

Using soil moisture data to estimate bioretention swale infiltration patterns and performance
Soil moisture sensors were installed in two bioretention swales at the IMAX corporate office to assess performance and determine if the swales are meeting design criteria. The sensors are resilient to winter conditions and can inform infiltration patterns year-round. Both bioretention swales had shallow and deep soil moisture and soil temperature sensors installed in the upstream and the downstream sides of the feature. Soil moisture monitoring took place for a year and a half.
Throughout the monitoring period, soil moisture patterns during non-winter months showed a fairly consistent pattern. Soil moisture would rapidly increase after a precipitation event followed by a rapid, tailing decrease, indicating that the swales are close to meeting their design criteria. During the winter, soil moisture patterns would become irregular when soil temperature fell below freezing but would quickly return to a pattern seen in non-winter months. This suggests that ice and snow impact bioretention performance, but quickly return to normal when temperatures rise above freezing. Soil moisture monitoring could be implemented in future bioretention features to effectively estimate performance during winter and non-winter months.
What is Low Impact Development?
Low impact development, or LID, is an integrated approach to stormwater management that mimics an area’s natural hydrologic conditions of pre-development (Drake, Bradford, & Marsalek, 2013). One of the most commonly used LID practices is bioretention swales. Bioretention swales are engineered soil/media filter systems that are designed to temporarily store and filter stormwater runoff through the process of infiltration.
Introduction
Assessing the relative rate at which water infiltrates through bioretention features can provide insight into their performance and determine if the features are meeting their design criteria. Increases in bioretention soil moisture are related to the amount of water entering the feature through runoff or precipitation, while decreases are primarily influenced by infiltration to the underlaying material with some influence from evapotranspiration (CVC, 2010). For soils with high infiltration rates, like the engineered soil found in bioretention swales, rapid changes in soil moisture generally indicate rapid infiltration of water through the soil profile.
Collected soil moisture data can be compared to the original design criteria and help inform operation and maintenance of the bioretention swales. The probes used to measure soil moisture are also resilient during winter conditions with an operating temperature to minus 40 degrees Celsius and can provide insight to bioretention performance during these times when other equipment is not as effective (ONSET, 2018). This study evaluates the performance of the IMAX corporate office bioretention swales using soil moisture data. Runoff from melt and rain can flow through the facility even when snow is being stored in the swales. Stored snow may limit the swale’s ability to collect and filter runoff, so conducting soil moisture monitoring during the winter is important to see any impacts to performance during the winter. Previous studies have used models, like DRAINMOD, that use soil moisture data to help estimate swale performance, but no study has used continuous soil moisture monitoring to directly estimate bioretention swale performance (Brown et. al., 2013 & Lisenbee et. al., 2020). These findings will help answer how soil moisture data can inform future LID design and operation and maintenance.
IMAX Technical Report
This brief builds on information in the IMAX Low Impact Development Feature Performance Assessment Report (CVC, 2022), which provides greater detail on the IMAX monitoring site and the performance of the LID features.
Site Description
To mitigate problems of ponding and winter ice build-up from poor site conditions, and to help provide water quality benefits to the Sheridan Creek subwatershed, the IMAX corporate office’s parking lot was expanded to a total drainage area of 1.0 hectares, or 9,978 square meters, from 0.76 hectares, or 7,570 square meters, and retrofitted with LID features between 2012-2013. This retrofit included bioretention swales, permeable pavement, and proprietary stormwater technologies. The retrofit was designed to suit the local hydrology and geology conditions of the site. Figure 1 shows the layout of the retrofitted parking lot, the sampling stations and catchment areas that drain into the different LID features. The three bioretention swales are IMAX-2, IMAX-3, and IMAX-4, located in catchment areas 2, 3 and 4 respectively. The 2022 technical report discusses how IMAX-4 had a catchment area 68% larger than originally designed following construction. This led to the feature being under designed and consequently, not adhering to design sizing guidance I:P ratios which resulted in under performance. The designs of the three bioretention features are listed below:
- IMAX-2 was designed with a Sorbtive Media Vault for phosphorus removal;
- IMAX-3 was designed with a Jellyfish Filter for the treatment of a number of pollutants;
- IMAX-4 was not designed with additional treatment features.
All three bioretention features were designed to treat runoff volumes from their respective drainage areas during events up to 25 millimeters and the 1-in-10-year storm event of 51.7 millimeters per the City of Mississauga minor system design criteria (Mississauga, 2020). Additionally, the bioretention swales were designed with a maximum drawdown time of 24 hours. Each bioretention swale was designed with an overflow drain that would convey runoff volumes beyond the bioretention’s capacity, referred to as an overflow event, directly to the outlet. Further detail regarding the description of the IMAX corporate office monitoring site can be found within the full IMAX technical report (CVC, 2022).
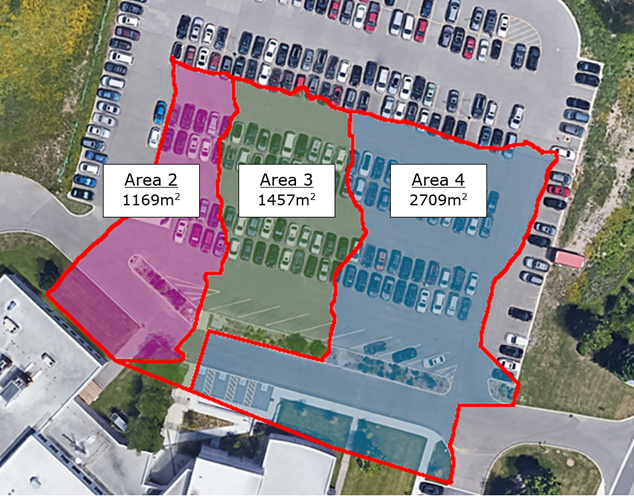
Figure 1: Map of the IMAX corporate parking lot showing the three catchment areas for the bioretention swales.
Approach
As part of the monitoring conducted at the IMAX corporate office parking lot, four soil moisture monitoring stations were installed in the upstream and downstream areas of the IMAX-2 and IMAX-4 bioretention swales. Figure 2 shows the locations of the soil moisture stations. Data collection at each station was set to the same ten-minute interval used for precipitation. Soil Moisture data downloads occurred approximately once per month between December 2017 and May 2019.
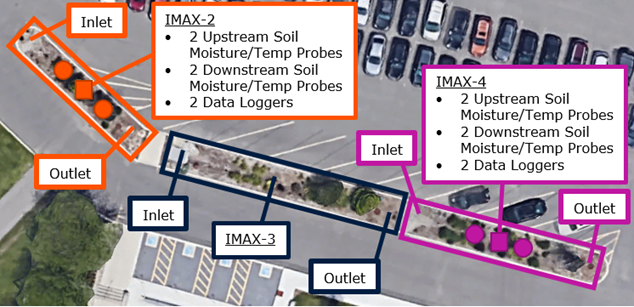
Figure 2: Map showing the location of equipment including data loggers, indicated by the squares, and soil moisture and temperature probes, indicated by the circles, at IMAX-2 and IMAX-4.
At both bioretention swales, the upstream station was installed closer to the curb-cut inlet towards left side of bioretention swales in Figure 2, while the downstream station was installed closer to the bioretention swale outlet. The upstream and downstream probes were approximately 6 meters apart from each other. Each of the four monitoring locations included two HOBO Soil Moisture Smart Sensors and two HOBO Temperature Smart Sensors installed at shallow and deep depths, approximately 10 centimeters and 30 centimeters below surface respectively.
The shallow and deep probes at each monitoring location were then connected to a HOBO USB Micro Station which logged the data. The two data loggers for each swale were installed approximately halfway in between the upstream and downstream probes to reduce the number of stations needed. The two data loggers at each swale were then bundled together to a wooden object, like a tree or stake. The setup of the soil moisture stations can be seen in Figure 3 and Figure 4.
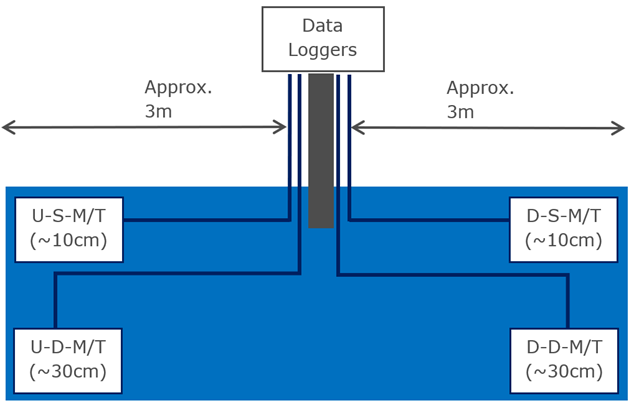
Figure 3: Left: Example probe setup cross section (Sample IDs: U or D (Upstream or Downstream) – D or S (Deep or Shallow) – M/T (Moisture and Temperature)).
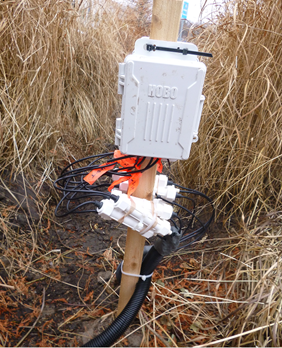
Figure 4: Data logger monitoring station.
In addition to the collection of soil moisture and temperature data, precipitation and air temperature data were collected using a Hydrological Services TB3 Heated Rain Gauge and air temperature sensor located approximately 22 m north of the IMAX parking lot. The rain gauge was located close to the site providing accurate precipitation data for the monitoring site.
To compare soil moisture responses throughout the monitoring period collected data was summarized on an individual precipitation event basis (winter and non-winter events are defined as a precipitation period of at least 2 millimeters where the six-hour period before and after contains no additional precipitation). The analysis of the soil moisture data involved reviewing the soil moisture response of each monitoring site to precipitation events of different sizes, intensities, and temperatures. The soil moisture response to wet weather events was first analyzed for the non-winter months to develop a baseline understanding for the soil moisture response at the two bioretention swales. Following this, winter events were then analyzed in comparison to understand how the soil moisture response differs from non-winter conditions during wet weather/melt events. Event responses for soil moisture were compared to design criteria of (1) treatment of runoff volumes for events up to 25 millimeters and (2) maximum 24-hour drawdown times.
Findings
Two key performance evaluation study questions are answered in the summaries below, addressing how the bioretention swales are performing based on soil moisture data along with how they perform during the winter months.
1. How do the bioretention swales perform according to soil moisture data?
A regular pattern of soil moisture and soil temperature responses was measured at all four shallow and deep monitoring locations during the monitoring period. At each station during non-winter months when the temperature was above freezing, changes in soil moisture appeared to show a regular pattern of rapid soil moisture increases following precipitation events and a rapid decrease post-event. At each site, soil moisture also showed more irregular increases and decreases that did not correlate with precipitation during the winter months when the soil temperature was subfreezing.
During a non-winter precipitation event an intense increase in soil moisture followed by a rapid decrease before tapering out over time would typically occur. This suggests that water is rapidly infiltrating into the soil and draining down through the soil profile. Additionally, changes in the shallow and deep soil moisture generally occur at the same time further indicating that water is infiltrating quickly through the soil to the deeper probes. Deep soil moisture sometimes decreases more slowly following an event, potentially as a result of water from smaller pore spaces draining out more slowly. The soil moisture responses during three events are shown in Figure 5, Figure 6, and Figure 7.
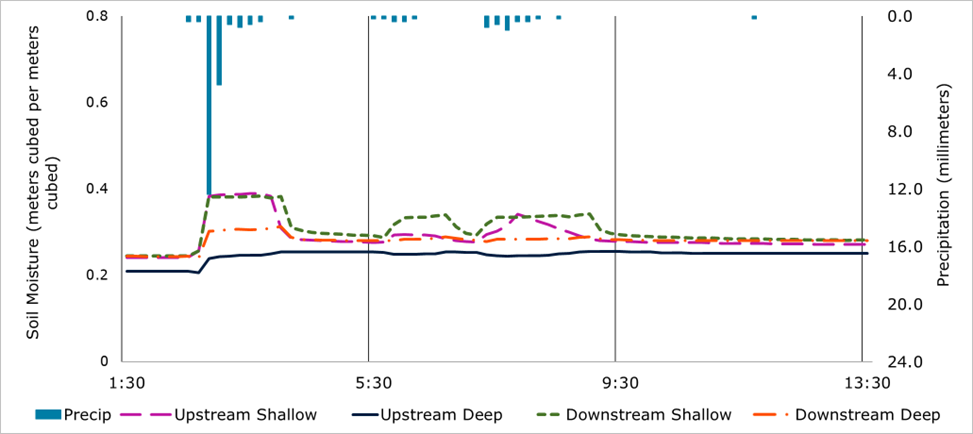
Figure 5: IMAX-4 soil moisture response on May 15, 2018. This event had a total precipitation of 25.8 millimeters and a peak intensity of 74.4 millimeters per hour.
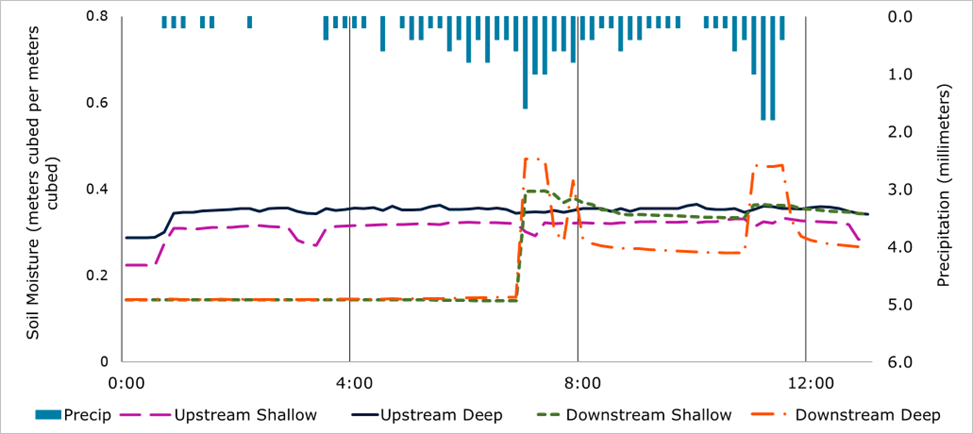
Figure 6: IMAX-2 soil moisture response on July 22, 2018. This event had a total precipitation of 24.4 millimeters and a peak intensity of 10.8 millimeters per hour.
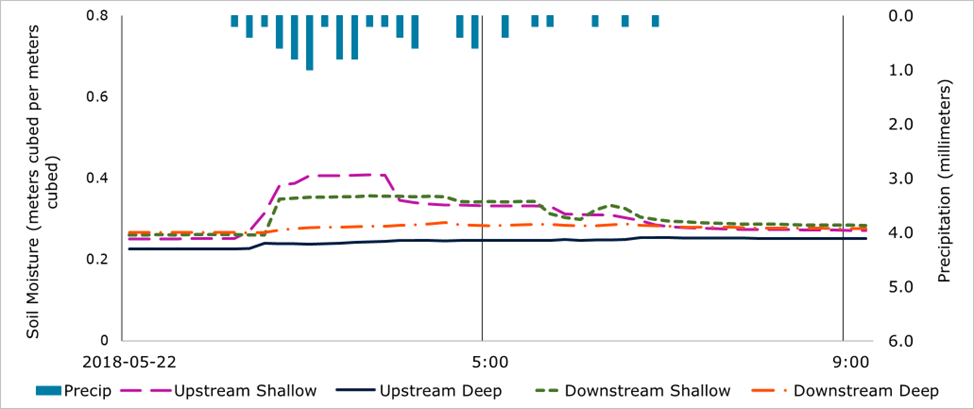
Figure 7: IMAX-4 soil moisture response on May 22, 2018. This event had a total precipitation of 8.8 millimeters and a peak intensity of 6 millimeters per hour.
During most events soil moisture appears to consistently reach a maximum level suggesting the point of saturation has been reached as seen in Table 1. These levels remain fairly consistent across all events, showing some fluctuation throughout the monitoring period. This is supported by the fact that the monitoring wells installed at the bioretention swales show some surface ponding during times when soil moisture has reached its maximum level.
Table 1: Average maximum soil moisture levels (point of saturation) of all soil moisture stations. Standard deviation range: 0.02-0.07 meters cubed per meters cubed.
| Swale | Upstream Shallow (meters cubed per meters cubed) | Upstream Deep (meters cubed per meters cubed) | Downstream Shallow (meters cubed per meters cubed) | Downstream Deep (meters cubed per meters cubed) |
| IMAX-2 | 0.323 | 0.372 | 0.382 | 0.464 |
| IMAX-4 | 0.408 | 0.287 | 0.387 | 0.328 |
Most events showed minimal lag between the shallow and deep soil moisture responses, however, a lag in upstream to downstream soil moisture response can be observed during most events. The three events above all show a lag in downstream soil moisture response, ranging in time from 30 minutes to 6.5 hours. During these events, soil moisture downstream begins responding once the intensity of the event increases. This may be caused by a lack of surface runoff near the downstream soil moisture stations.
Both bioretention swales had very few events that produced overflow, further supporting the findings that suggest the swales are performing well. The technical report for the IMAX site indicates that 98% of events under 25 millimeters at IMAX-2 produced no overflow and those that did had intensities above 37 millimeters per hour. IMAX-4 had 29% of events under 25 millimeters produce overflow, however, since the catchment area of IMAX-4 ended up being larger than originally designed, more water was entering the swale than originally planned resulting in more overflow events.
In summary, evidence shows that soil moisture data can be used to inform bioretention design as well as bioretention operation and maintenance. The little to no lag seen between shallow and downstream soil moisture responses and the post-event soil moisture returning to pre-event levels after 24 hours shows that the bioretention swales are close to meeting their design criteria. If swales are not built to meet their design criteria, or if there are any issues on a site that need to be addressed, soil moisture data can help identify these issues.
2. How do the bioretention swales perform during the winter months?
An irregular soil moisture pattern observed during the winter months shows sustained increases and decreases in soil moisture that do not always correlate with precipitation. Figure 8 and Figure 9 below shows the upstream and downstream irregular soil moisture responses respectively at IMAX-4 for two winter events that occurred on February 19, 2018 and February 21, 2018 during a freeze-thaw cycle. Between early February 19 and late February 21, air temperature rose well above freezing likely resulting in increased snowmelt during that period.
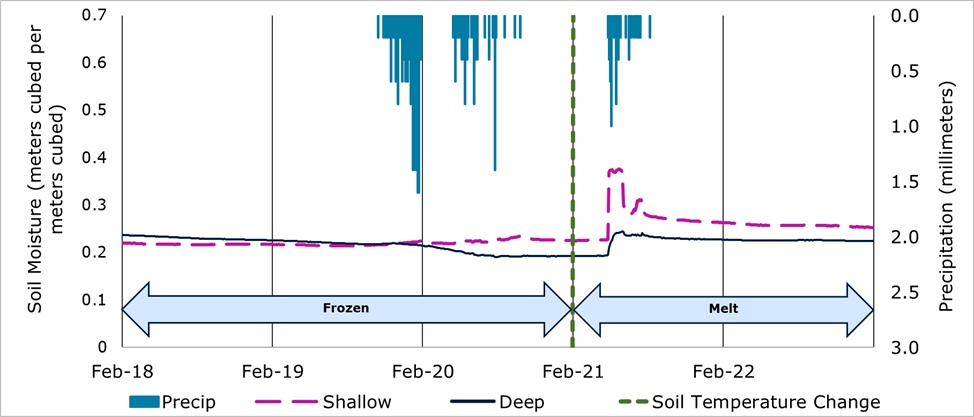
Figure 8: IMAX-4 upstream soil moisture response during two precipitation events on February 19, 2018 (28.4 millimeters) and February 21, 2018 (6.8 millimeters).
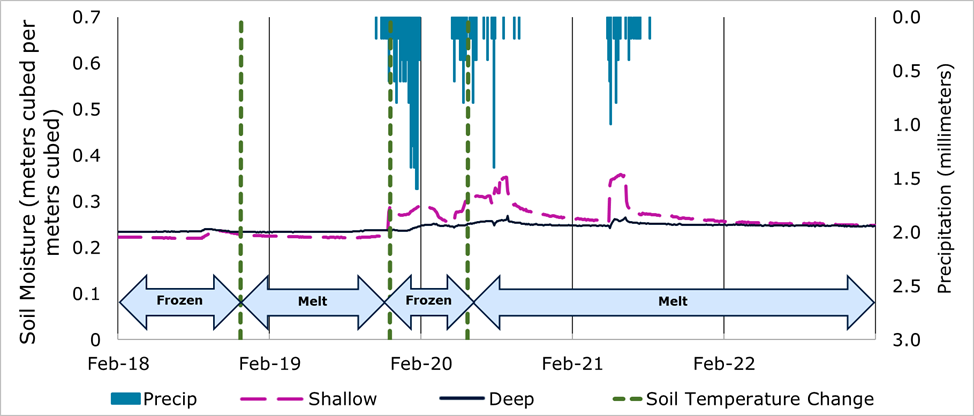
Figure 9: IMAX-4 downstream soil moisture response during two precipitation events on February 19, 2018 (28.4 millimeters) and February 21, 2018 (6.8 millimeters).
Once the shallow soil temperature rises above freezing both the upstream and downstream responses follow a more regular pattern. The upstream shallow soil would remain below freezing until late February 20, 2018. This frozen shallow soil likely prevented infiltration from precipitation or melting snow during the event on February 19, 2018. This may explain why the shallow soil moisture increases only a little during that event. The frozen shallow soil is also likely preventing water from infiltrating to the deeper soil, resulting in the decrease in soil moisture seen from late February 19 through early February 21. The downstream stations respond in a similar way after experiencing two earlier melting periods. A small response can be seen following the first melt/freeze cycle with a larger response seen following the second melt period.
Similar soil moisture response patterns can be seen in other winter events. Figure 10 and Figure 11 below shows the upstream and downstream soil moisture responses at IMAX-2 for a precipitation event on February 24, 2019. During this event, the air temperature remains well below freezing. Prior to the start of the event both the upstream shallow and deep soils were below freezing while the downstream soils remained above freezing. Just over an hour before the start of the event, the upstream deep soil temperature rose above freezing and remained above freezing for the next several days.
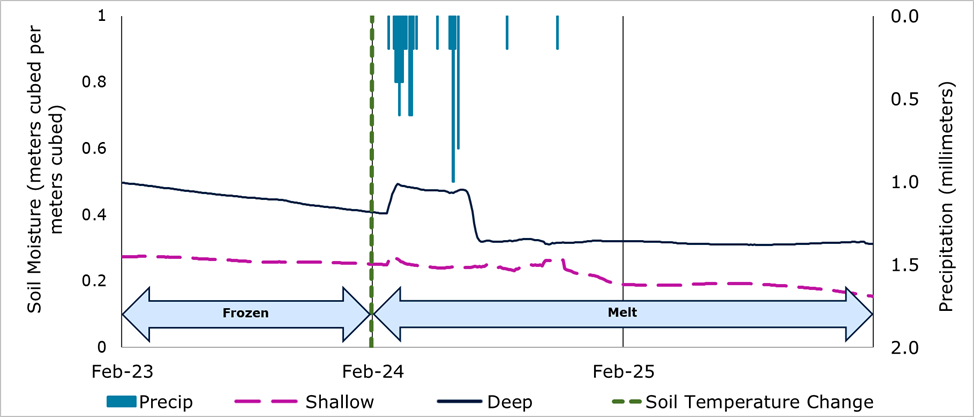
Figure 10: IMAX-2 upstream soil moisture response during a precipitation event on February 24, 2019 (7.6 millimeters). Deep soil temperature rises above zero late on February 23.
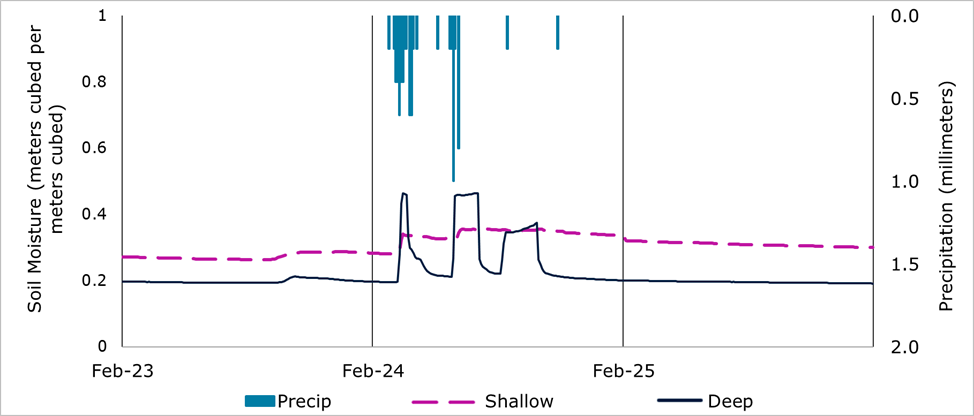
Figure 11: IMAX-2 downstream soil moisture response during a precipitation event on February 24, 2019 (7.6 millimeters).
While the upstream shallow soil remains frozen throughout the event, the deep soil moisture responds more to the event. The frozen soil around the shallow soil moisture probe likely prevented a large increase during the event, while melting water and precipitation caused the larger response deeper. Following the event, the upstream shallow soil moisture continues decreasing, while the downstream soil moisture increases slightly. This likely is a result of the shallow soil remaining mostly frozen while some water continues percolating down towards the deep sensor. A similar but larger response can be seen downstream. Since the downstream soil remained above freezing more precipitation and melt water would have been able to infiltrate into the soil.
When soil temperatures rose above freezing, the soil moisture response quickly showed patterns similar to non-winter events. Comparing the winter soil moisture response with the design criteria for the swales is difficult due to the irregular soil moisture patterns displayed during freezing conditions. However, the fact that the soil moisture response pattern becomes more regular once the soil is no longer frozen suggests ice and snow are likely the causes of the irregular soil moisture patterns seen throughout the winter months of the monitoring period.
Overall, using soil moisture data to monitor bioretention swales during the winter is important as it allows for year-round performance monitoring that can ensure the swales are meeting their design criteria. Since some monitoring equipment cannot be used in the winter, soil moisture probes can be used during that time and could help catch maintenance concerns earlier than other monitoring methods that can only be utilized in more temperate seasons.
Conclusion & Recommendations
Soil moisture patterns responded similarly to precipitation events of different sizes and intensities by rapidly increasing and decreasing to pre-event levels close to the 24-hour period of the design criteria. No significant lag is present between shallow and deep probes further indicating water infiltrates rapidly through the soil. Additionally, the properly constructed and sized bioretention swale closely met its design to treat events up to 25 millimeters. All this indicates that the bioretention swales are performing close to their design criteria.
During the winter when temperatures fell below freezing, the soil moisture patterns became irregular indicating that ice and snow buildup impacts the amount of infiltration that can occur from precipitation and meltwater. Once temperatures rose above freezing, soil moisture began showing response patterns similar to the non-winter months, suggesting that bioretention swales can still effectively perform during the winter.
Monitoring bioretention swales with soil moisture sensors will allow for performance assessments to occur year-round. This can help inform if the swale is meeting its design criteria or if there are any maintenance requirements that need to be addressed. Operation of the soil moisture equipment can be done in tandem with monitoring wells. Future studies should continue to look at the relationship between soil moisture data and bioretention performance and to look at the long-term monitoring of soil moisture and how it can further inform design, operation, and maintenance of bioretention swales. Future studies should also look to compare other monitoring methods to gain a better understanding between soil moisture and performance.
References
Brown, R., Skaggs, R., & Hunt III, W. (2013). Calibration and validation of DRAINMOD to model bioretention hydrology. Journal of Hydrology.
CVC. (2010). Low Impact Development Stormwater Management Planning and Design Guide. Credit Valley Conservation. Retrieved from Sustainable Technologies Evaluation Program Wiki: https://wiki.sustainabletechnologies.ca/wiki/Bioretention.
CVC. (2022). IMAX Low Impact Development Feature Performance Assessment. Credit Valley Conservation & Sustainable Technologies Evaluation Program.
Drake, J., Bradford, A., & Marsalek, J. (2013). Review of environmental performance of permeable pavement systems: state of the knowledge. Water Quality Research Journal of Canada, 48.3, 203-222.
Lisenbee, W., Hathaway, J., Negm, L., Youssef, M., & Winston, R. (2020). Enhanced bioretention cell modeling with DRAINMOD-Urban: Moving from water balances to hydrograph production. Journal of Hydrology.
Mississauga. (2020). Development Requirements Section 8 – Storm Drainage Design Requirements. City of Mississauga. Retrieved from https://www.mississauga.ca/wp-content/uploads/2020/08/26144147/Section-8-Storm-Drainage-Design-Requirements-1.pdf.
ONSET. (2018). HOBO Data Loggers – Soil Moisture Smart Sensor (S-SMx-M005) Manual. ONSET.