

ThermalPoint Case Study 2
Prepared by The Sustainable Technologies Evaluation Program (STEP)
March 2025
Contact: step@trca.ca
Background
The thermal balance point temperature (TBPT) is a key metric for sizing heat pumps. It represents the outdoor temperature at which a heat pump can no longer meet a home’s heating demand without supplemental heating. Graphically, the TBPT is the outdoor temperature where the heat pump capacity curve intersects the heating load line of the home.
In practice, a home does not have a single, fixed thermal balance point temperature, as heat loss, internal gains, solar gains, thermostat setpoints, and other factors can vary throughout the day—even if the outdoor temperature remains constant. However, TBPT is nonetheless a useful metric for heat pump sizing and thermostat programming.
Using historical natural gas consumption data, the new ThermalPoint web application (thermalpoint.ca) estimates the TBPT and the percentage of the annual heating load that can be met solely by a heat pump.
Introduction
This case study series presents the results of applying ThermalPoint to real homes. In previous work [1], STEP piloted hybrid heating systems in Peel Region, collecting utility consumption data before and after heat pump installations in several homes. Smart thermostat data was also gathered. This data was used to assess the accuracy of the ThermalPoint tool in predicting TBPT.
Home Profile
Home 2 from [1] is a 1,202 ft² (above grade) semi-detached, two-storey home in Caledon, ON, built in 2005. An EnerGuide audit, completed just prior to the installation and shared with the analysis team, estimated the home’s design heat loss (DHL) at 10.4 kW (35.5 kBTU/h). This is shown in Figure 1. On November 27, 2023, an air-source heat pump (Outdoor unit: Moovair DMA24HOS20230E7; Indoor Coil: CUB24HAC20BWT7A; AHRI # 212361759) was installed (Figure 2). The rated nominal capacity of the system at 47 °F was 2-Tons. It was integrated with an existing Lennox G41UF-36B-070-02 (1-stage) furnace, with a rated AFUE of 90% and a heating output of 66,000 BTU/h.
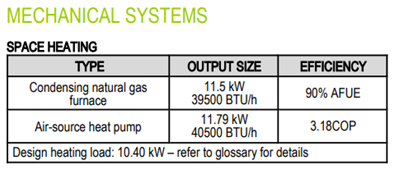
Figure 1. The DHL was estimated by an EnerGuide audit. Note that the furnace specifications assumed in the EnerGuide audit differ from the actual specifications listed above, but this would not have impacted the DHL calculation. Also note that this screenshot is from the post-retrofit report.
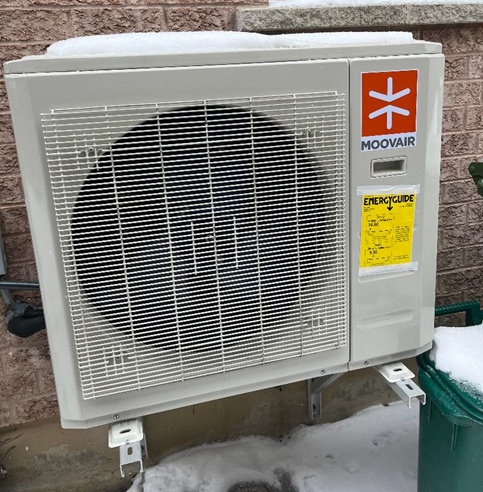
Figure 2. The heat pump was installed at the home in November 2023.
Data Collection
Natural gas consumption data was totaled from utility bills for one year before the heat pump installation. From November 19, 2022, to November 19, 2023, the home consumed 1,931 m³. Gas consumption data from the summer months suggested a fixed base load for domestic hot water and other uses of approximately 30 m³ per month.
Methodology
TBPT was estimated using three approaches:
- Standard Approach: A heating load line was plotted using the EnerGuide audit DHL and the design outdoor temperature of -18.3°C assumed for the location [2], and also assuming zero heat load at 16°C. The heat pump maximum capacity curve (sourced from the [3]) was overlaid to estimate the TBPT.
- ThermalPoint: Inputs including the annual gas consumption for 2022 (1,931 m³), base monthly gas load (30 m³), heat pump maximum capacity curve (28,000 BTU/hr at 8.3°C; 23,000 BTU/h at -8.3°C; 20,000 BTU/h at -15°C), and furnace AFUE (90%) were entered into the ThermalPoint tool algorithm to estimate the TBPT. Note that this case study considered annual gas consumption for 2022/2023, while ThermalPoint currently requires the most recent data from 2024 because that is what is most readily available via the Enbridge “My Account” portal.
- Smart Thermostat Data: Ecobee thermostat data provided 5-minute interval runtime for the heat pump and furnace, along with outdoor temperature. A curve was developed showing the proportion of heat pump runtime relative to total heating runtime, including both furnace and heat pump, as a function of outdoor temperature. A maximum TBPT was inferred as the temperature at which the furnace took over for the heat pump and began to operate more significantly.
This data reflects actual system performance but may not represent a control strategy that optimized heat pump utilization to the greatest extent. To check if the heat pump may have had sufficient heating capacity in temperatures colder than the maximum TBPT, the frequency of operation of the heat pump was plotted as a function of the outdoor temperature.
Thermostat data from January 1st 2024 to May 31st 2024 was used. Only overnight data was used because, in this home, the homeowner’s frequently made manual changes to the heating set-point and this occasionally caused the furnace to engage in milder temperatures.
Results
- Figure 3 shows that the standard approach estimated a TBPT of -6.6°C while ThermalPoint estimated a TBPT of -12.5°C with a 0% safety margin. With a 25% safety margin, the TBPT estimated by ThermalPoint was -8.5°C. The safety margin is user-defined and simply applies a multiplicative factor to the estimated heat loss from the tool, which then predicts TBPT to be at a warmer value.
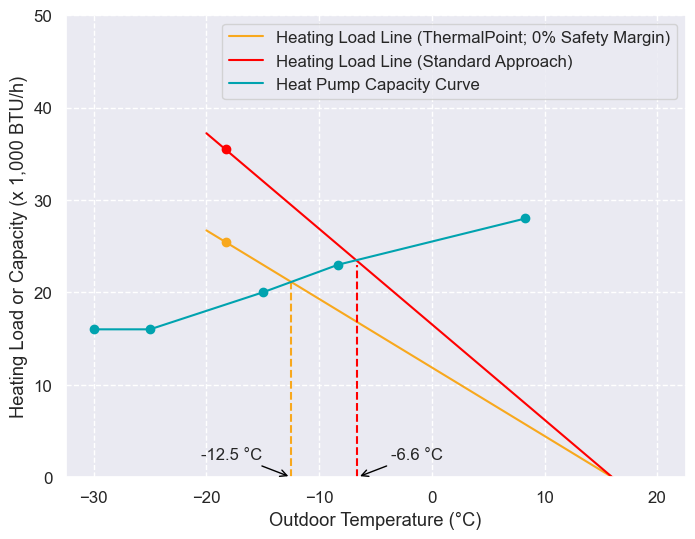
Figure 3. The thermal balance point is the intersection of the heating load line and the heat pump capacity curve. The standard approach estimated TBPT to be -6.6°C while ThermalPoint estimated it to be -12.5°C (assuming 0% safety margin).
- Smart thermostat data indicated that the heat pump operated independently down to an outdoor temperature of -9°C, and below that the furnace turned on (Figure 4). The thermostat data also showed that the home had frequent manual changes and was typically between 21°C to 24oC.
- The heat pump likely was able to handle the heating load of the home in temperatures colder than -9°C. The data used for Figure 4 was plotted to create Figure 5, which shows the fraction of time the heat pump was operating in the home as a function of outdoor temperature. When the system was reverting to the furnace, the heat pump was on approximately 80% of the time, indicating there was still unutilized heating capacity from the heat pump (i.e. it was not on 100% of the time). Given the data from Figure 5, ThermalPoint’s prediction of TBPT of -12.5°C is reasonable.
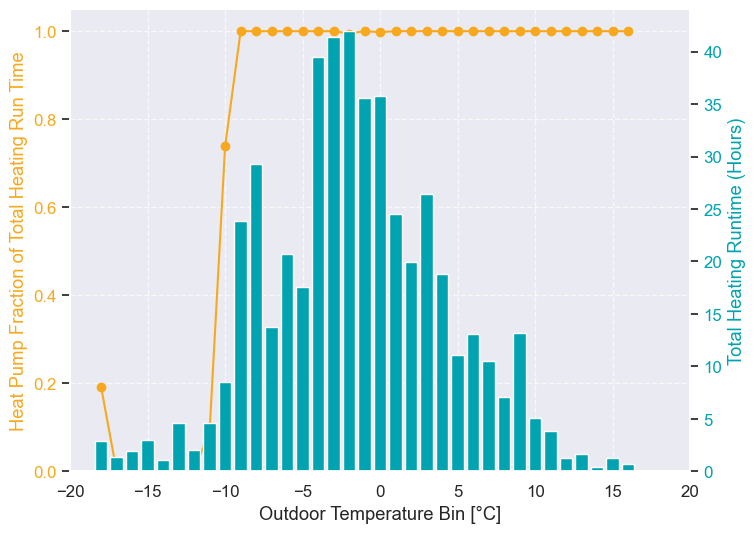
Figure 4. The bar plot shows the total runtime for the heating system including both the heat pump and furnace. The gold line plots the fraction of the total heating runtime that was from the heat pump. For example, at 0°C there was 35 hours of heating system runtime and it was 100% from the heat pump. Below -9°C, the furnace engaged substantially.
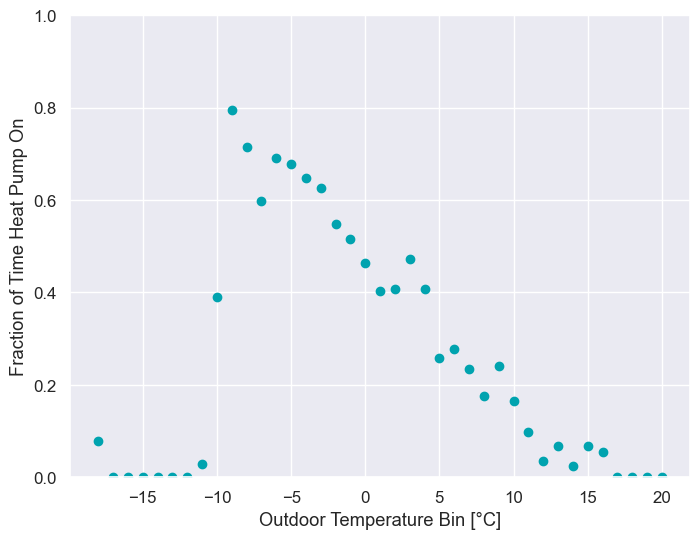
Figure 5. When the system reverted to the furnace, the heat pump had been operating approximately 80% of the time on average. The heat pump could have likely heated the home in temperatures a few degrees cooler than -9°C.
Conclusion
When using a safety factor of 25%, ThermalPoint’s TBPT prediction aligned very closely with the standard approach and also with operating range of the heat pump observed post-installation. However, the heat pump was likely not being fully utilized and could have heated the home in slightly colder conditions. With this in mind, ThermalPoint’s TBPT prediction assuming a 0% safety margin is likely achievable in the home. Overall, this case study demonstrated that ThermalPoint provided reasonabe TBPT predictions that aligned well with the home’s real-world heat pump performance.
[1] STEP. Replacement of Air-Conditioners with Cold-Climate Air-Source Heat Pumps: Pilot Project Findings in The Region of Peel. July 2024. https://sustainabletechnologies.ca/reports/hybrid-heat-pump-pilot-in-peel-region/
[2] NRCan. HOT2000 Climate Map. https://open.canada.ca/data/en/dataset/4672733b-bbb6-4299-a57f-f19ab475ac11
[3] NEEP. ASHP Product List. https://ashp.neep.org/#!/product_list/
Supporting data and analysis available as a Python Jupyter Notebook on request to step@trca.ca.
Funding support for ThermalPoint provided by The Atmospheric Fund (TAF).