
Case Study: Evaluating the performance of different winter maintenance products on permeable and conventional asphalt.
Background
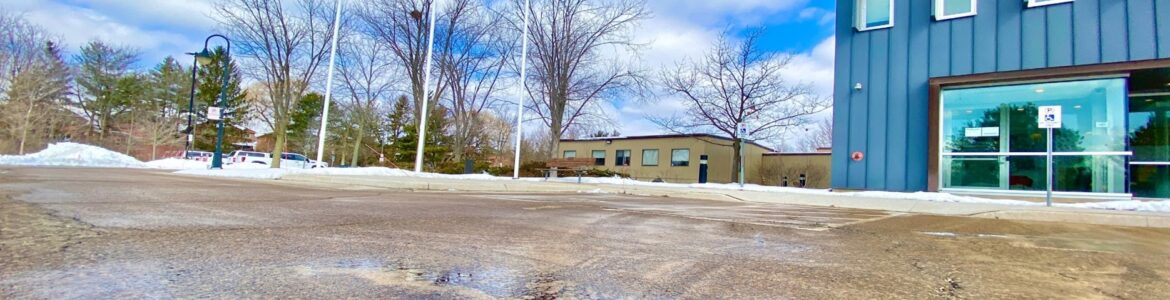
Credit Valley Conservation’s (CVC) head office is part of the Meadowvale Conservation Area, adjacent to the Credit River (Figure 1).
During winter, salt is applied to the entrance driveway, parking lots, and sidewalks to keep staff and visitors safe and minimize slip and fall incidents.
However, chloride (the main ingredient of winter salt) contaminates soils and water, harming plants, wildlife, pets, and human health. Additionally, salt is highly corrosive and damages infrastructure and vehicles.
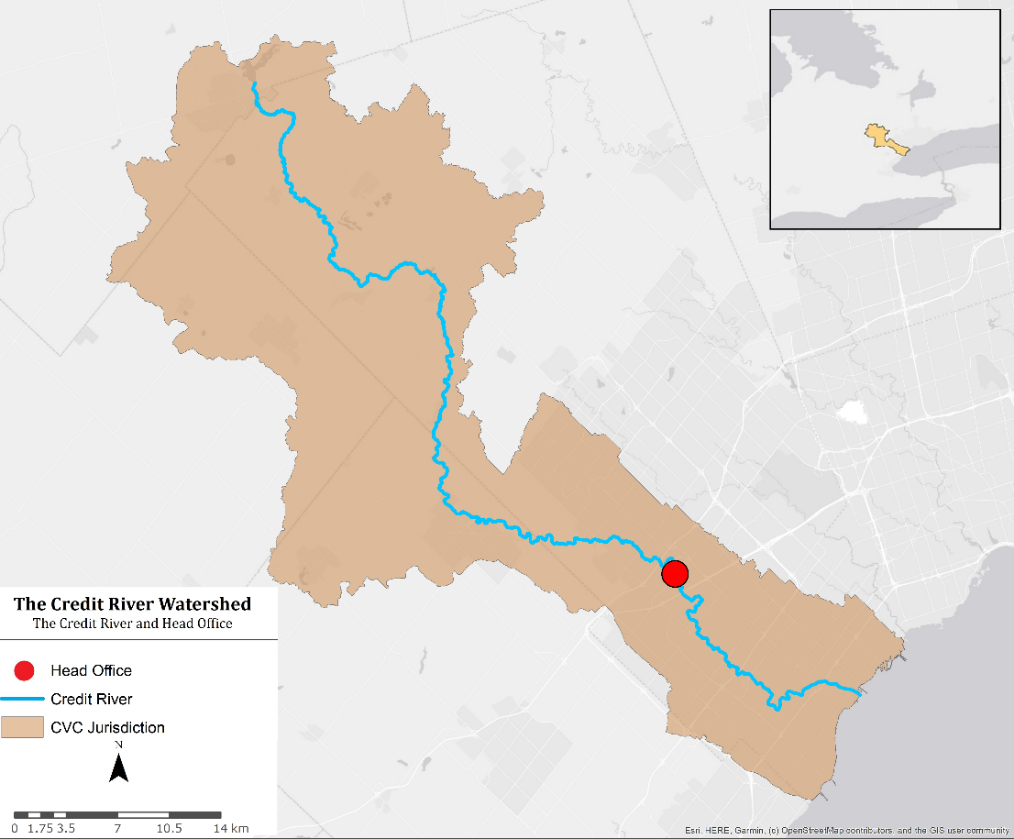
Figure 1. Credit Valley Conservation Head Office site location in the Credit River Watershed
Therefore, to reduce the head office’s chloride contribution to the watershed while still maintaining safety, we released our Salt Management Plan (SMP)[1] in February 2022. The main recommendations of this plan include:
- Liquid products should be used whenever feasible.
- Solid salt should always be pre-treated.
- Liquids should not be used on the permeable pavement (as they could infiltrate immediately after application without working) [2][3].
To effectively adhere to the SMP’s recommendations and reduce the impact of our head office’s winter maintenance, we conducted a study funded by the Ministry of the Environment, Conservation, and Parks, to validate the recommendations during the winter of 2022-2023. The objectives of the study were:
1) understand the performance of different anti-icing and de-icing products available on the market.
2) determine whether products with less chloride can be used to provide safe traction during winter.
3) investigate how effective liquid anti-/de-icers are at maintaining safe winter conditions on permeable pavement at the CVC head office.
How salt-based winter maintenance products work
Winter maintenance products require moisture to work. When a solid product (rock salt, NaCl) is used, it reacts with moisture in the environment or in the surrounding snow to form brine. The brine then spreads out and after coming in contact with more snow forms more brine[1]. When a liquid product is used, melting begins immediately, and brine is gradually diluted as more snow melts. This melting process impacts the solid and liquid products’ behavior on permeable and impermeable surfaces.
Methods
CVC’s head office parking lot is made up of two types of pavement (Figure 2):
- Conventional asphalt (CA), which consists of a base layer of Hot Mix Asphalt (HL3) aggregate mixed with sand, and a top layer of HLA3 (same as HL3 but with less sand in the mix), with a total depth of approximately 10 centimeters.
- Permeable Pavement (PP), with three layers: an 80-millimetre Uni Eco-Stone paver held by a metal edging restraint; a 25-millimetre layer of chip stone; a base layer of granular concrete, and a 100-millimetre diameter underdrain[4].
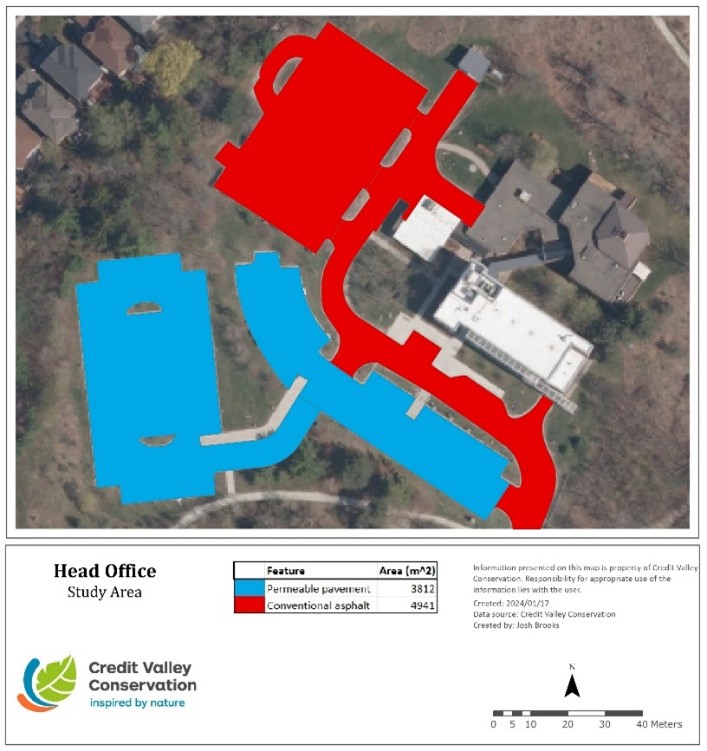
Figure 2. Map of Credit Valley Conservation Head Office. The two types of pavement are highlighted, conventional asphalt (red) and permeable pavement (blue)
We used four products in the study, two liquids and two solids (Table 1), which were applied as both anti-icer (up to 24 hours before snow) and de-icer (immediately after shoveling) on both CA and PP surfaces. We blocked off two areas for the study, one on each pavement type, and asked the contractor not to maintain them. Then we divided each area into five plots, one for each product plus one control that received no product (Table 1). Each plot was 2.5 m by 3 m and was treated with the same product for anti-icing and de-icing.
The application rate used for all products was the recommended medium application rate, per our SMP1 and literature[5]: 0.05 kg/m2 for solid products and 0.03 L/m2 for liquids. We applied the product as an anti-icer up to 24 hours before the forecasted start of snowfall. When the snowfall stopped, the plots were shoveled to mimic plowing, and the same product was applied as de-icer. We then monitored the plots for snow coverage and friction until bare pavement was achieved.
Table 1. Winter maintenance products and their composition. Products are organized from lower to higher chloride concentration.
| Product | Composition | Salt (NaCl) % | Water % | Beet Juice % | Total Cl (grams)* | Liquid/ Solid |
| Control | N/A | N/A | N/A | N/A | N/A | N/A |
| Fusion 2330 | Beet juice + Sodium Chloride (NaCl) brine | 16 | 54 | 30 | 3 | Liquid |
| Salt Brine | Sodium Chloride (NaCl) + water | 23 | 77 | 0 | 4 | Liquid |
| Fusion Treated Salt | Beet juice + Sodium Chloride (NaCl) | 99 | 0 | 1 | 29 | Solid |
| Rock Salt (NaCl) | Sodium Chloride (NaCl) | 100 | 0 | 0 | 30 | Solid |
To evaluate the performance of the different products, we used two metrics:
• Bare Pavement Regain Time (BPRT): the length of time to achieve bare pavement (0% snow coverage) after the first de-icing application. It was estimated using security and monitoring camera footage.
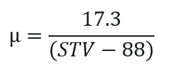
• Surface friction: Friction was measured using a Slip Alert device[6] for each plot after shoveling
to evaluate the anti-icing product effect. It was also measured every hour after applying the de-icing product until bare pavement was achieved. SlipAlert Values (STV) were converted to Coefficient of Friction (µ) with the formula below, which was provided by the manufacturer.
The results were assessed for level of risk using the scale provided by Slip Alert (Table 2).
Table 2. Coefficient of Friction values and its corresponding slip risk categories
| Coefficient of Friction (µ) | Slip Risk |
| >0.5 | Low risk (Safe range) |
| 0.3 – 0.5 | Medium Risk |
| <0.3 | High Risk |
Results
Over the 2022/2023 winter season, we collected BPRT and surface friction data from five winter weather events.
Bare Pavement Regain Time (BPRT)
We recorded contrasting BPRT results between both pavements (Figure 3). Snow takes less time to melt on CA than on PP. These differences in the BPRTcan be due to the melting processes. On CA moisture is retained on the surface and the brine can spread and melt the surrounding snow. On PP brine can drain through the gaps between paving stones limiting how far it can spread and how much snow can be melted[7].
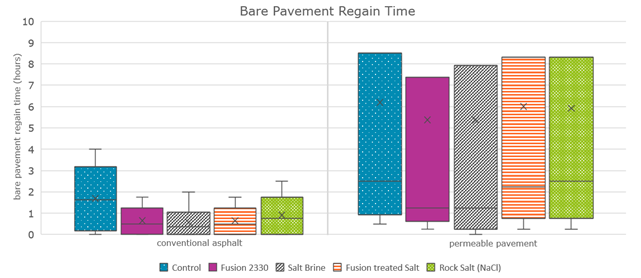
Figure 3. Bare Pavement Regaining Time (BPRT) for the five plots: Control, Fusion 2330 (liquid), Salt Brine (liquid), Fusion Treated Salt (solid), and Rock Salt (solid). On the graph, treatments are organized from lower to higher chloride concentration.
Although all products had a similar performance, liquids (Fusion 2330 and salt brine) had the lowest BPRT on both surfaces suggesting that they can achieve the same or better level of service compared to solid products. The difference was more pronounced on PP than on CA (Figure 3). We believe this is because liquids can be applied uniformly across the surface, so every paving stone receives liquid. When solids are used, however, the resulting brine can only spread out as far as the nearest joint between paving stones. If a particular stone receives no, or very few granules of salt, then melting will not be effective in that area (Figure 4). Furthermore, solid salt is subject to bouncing and scattering which can result in salt granules migrating into the joints in between stones, rather than staying on top of the stones themselves.
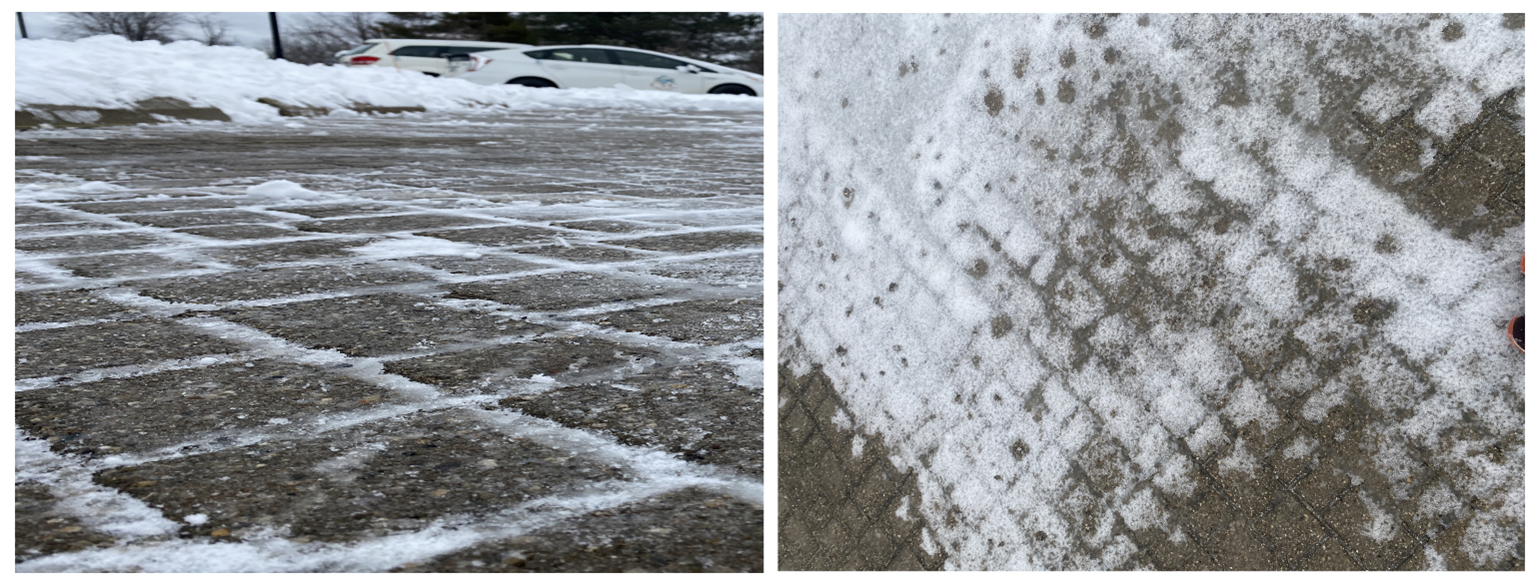
Figure 4. Permeable pavement after the application of liquid (left) and solid (right) products.
Surface Friction
Permeable Pavement achieved safe friction up to one hour faster than CA (Figure 5), even with a longer measured BPRT. This is likely because not all surface conditions (e.g., slush, ice, wet areas) are visible on the monitoring or security cameras and may appear as bare pavement. Thus, a lower BPRT does not necessarily reflect a safe friction level.
On CA, median friction values for salt brine and rock salt are in the safe friction range (see Table 2 for slip risk range) immediately after shoveling and before de-icing, meaning that these products are acting effectively as anti-icer. Thirty to 60 minutes after shoveling and de-icing, all treatments’ median friction levels are safe. However, the control, salt brine, and pre-treated salt occasionally reached medium-risk friction levels. In this time frame, rock salt obtained the highest median friction and Fusion 2330 obtained the most consistency in measurements. Two hours after de-icing, all CA plots had achieved safe friction except one reading on the control plot. All treatments, including the control, achieved a median friction in the safe range, with Fusion 2330 being the highest.
On PP, all anti-icing treatments’ median friction levels were in the safe range immediately after shoveling and before de-icing, maintaining high friction levels afterward. Although the de-icers were still applied to the plots, is important to note that for some events we achieved safe friction levels just by applying anti-icing and shoveling, even before bare pavement was fully regained. This suggests that de-icers may not be needed on PP in all circumstances and further chloride reductions can be achieved if only liquid anti-icing products are used. Fusion 2330 obtained the highest median friction two hours after shoveling and de-icing.
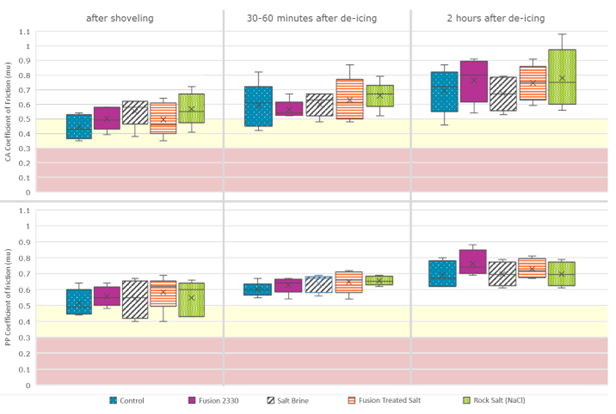
Figure 5. Surface friction measured on study plots immediately after shoveling, 30 to 60 minutes after de-icing, and two hours after de-icing. Light-red shading indicates high-risk (<0.3 µ) and light-yellow shading indicates medium-risk–wet conditions (0.2 µ -0.5 µ). No shading (>0.5 µ) values are considered safe.
Liquid products’ performance as anti-icer on permeable pavements
We observed that liquid products applied as anti-icer on PP slowed down the rate of snow accumulation (Figure 6). As the snow accumulates, liquids are actively melting it, delaying the accumulation even after 6 hours of continuous light snowfall. This demonstrates that while some product may be lost to infiltration, enough liquid can adhere to the surface of the paving stones to function as an anti-icer.
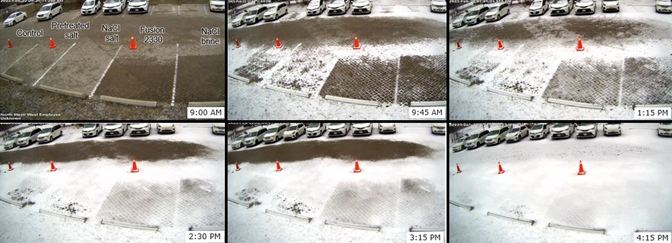
Figure 6. Snow melting over time on February 2, 2023. Each parking stall received a different product, from left to right: control, pre-treated salt, NaCl rock salt, Fusion 2330 (liquid), and NaCl brine (liquid).
Chloride reduction by using rock salt alternatives.
All the products we tested had an acceptable performance and provided safe levels of service on both types of pavements, regardless of their chloride content. We found that the plots using liquid products (Fusion 2330 and salt brine) received 84 % and 79 % less chloride, respectively, than the rock salt plots (Table 1). The pre-treated rock salt resulted in 8 % less chloride application. While several barriers remain to replace rock salt with liquids on a large scale, liquid alternatives offer a promising solution for considerably reducing chloride application while still delivering the same level of service.
Conclusions
During the 2022-2023 winter season, CVC conducted a study to evaluate the effectiveness of various winter maintenance products and explore the use of less toxic alternatives while providing a safe level of service to CVC staff and visitors. Additionally, we tested how effective liquids are on our permeable pavement. We found that:
- Using liquids is the leading Best Management Practice for chloride reduction, as it can reduce up to 80 % chloride application while providing the same or better safety when compared to solid products.
- Conventional asphalt takes less time to regain bare pavement compared with permeable pavement. This may be because ice or slush conditions are not always apparent on camera footage and will look like bare pavement.
- Permeable pavement obtained more consistently safe levels of friction than conventional asphalt, even before de-icing was applied. Medium-risk friction levels were obtained on CA often due to wet/slushy conditions.
- Liquid products were more effective on permeable pavement than solids due to how evenly the liquid products were applied.
- Liquid products were effective at slowing down the accumulation of snow on permeable pavement when used as an anti-icer. The product may not have infiltrated enough to reduce its effectiveness.
- Bare pavement may not be the best indicator of level of service for permeable pavements. While the surface of the permeable pavement may have a thin layer of snow, that snow is often drier with a higher friction level than a conventional asphalt surface that is technically clear now, but still wet or slushy.
In summary, transitioning from rock salt to liquids at CVC is a beneficial incremental change that can reduce chloride usage by up to 80% and decrease chloride loading into the Credit River. We are continuing our data collection. The results presented here are based on one season of monitoring with only five events. We are continuing to collect data into the 2023/2024 winter season to validate these results.
Recommendations
This case study shows promise for broader-scale application. Some recommended areas for future research and initiatives include:
- Winter maintenance product evaluation at full parking lot scale. Our study findings are dependent on an experimental plot, it is recommended to perform a comparable assessment on a larger scale, like a full parking lot.
- Research into how much chloride infiltrates with the use of liquids vs. solids on permeable pavement. Our study did not evaluate how much chloride infiltrated, rather, examined the effectiveness of different winter maintenance materials.
- Further studies on different types of permeable pavement. Our results are based on the type of permeable surface we have at CVC head office. Many different types of permeable surfaces exist, therefore, similar studies on other types are recommended.
- Communicating the outcomes of this study to contractors and property managers to encourage the use of liquids on permeable pavement. There are many barriers to contractors for the widespread adoption of liquids (e.g., training, investing in new equipment, liability). All evidence showing the effectiveness of liquid anti-/de-icers will help demonstrate the need to address these barriers.
References
[1] Credit Valley Conservation. (2022). Salt Management Plan. Mississauga, ON: Water and Climate Change Science Department.
[2] Minnesota Pollution Control Agency. (2020, August 27). MPCA Smart Salt Training.
[3] Fay, L., & Akin, M. (2014). Snow and Ice Control on Porous and Permeable Pavements: Literature Review and State of the Practice. Transportation Research Board 93rd Annual Meeting. Washington DC: Transportation Research Board.
[4] CVC Water and Climate Change Science Division. (2016). Low Impact Development Infrastructure Performance and Risk Assessment. Mississauga, ON: Credit valley Conservation Authority.
[5] Hossain, K. (2014). Optimum Deicing and Anti-icing for Snow and Ice Control of Parking Lots and Sidewalks. Waterloo: University of Waterloo.
[6] SlipAlert. (2024). Floor Slip Testing. Retrieved from SlipAlert: https://slipalert.com/slip-testing/
[7]> Weiss, P., Kayhanian, M., Khazanovich, L., & Gulliver, J. (2015). Permeable Pavements in Cold Climates: State of the Art and Cold Climate Case Studies. Center for Transportation Studies, University of Minnesota.