
Replacement of Air-Conditioners with Cold-Climate Air-Source Heat Pumps: Pilot Project Findings in The Region of Peel
Prepared by The Sustainable Technologies Evaluation Program (STEP)
July 2024
Contact Information: step@trca.ca
Executive Summary
Background
Climate change is an existential threat. It is driven by carbon emissions from human activities. In the Greater Toronto and Hamilton Area (GTHA), buildings are the largest carbon emitters due to fossil fuels like natural gas that are used for heating. Electrically-driven air-source heat pumps (ASHPs) offer a lower-carbon alternative to traditional fossil fuel heating systems.
An ASHP functions like an air-conditioner (A/C) that can reverse to provide heating as well as cooling. When an ASHP is paired with a furnace in a home, it is called a hybrid system. In these systems, the ASHP handles all cooling and much of the heating, with the furnace typically used as back-up in colder conditions.
Advancements in cold-climate ASHPs (CCASHPs) have improved upon the cold temperature performance of conventional ASHPs, and recently there have been further improvements in affordability and compatibility with existing fossil fuel furnaces. These developments open new possibilities for efficient, cost-effective, and low-carbon home heating and cooling.
Study
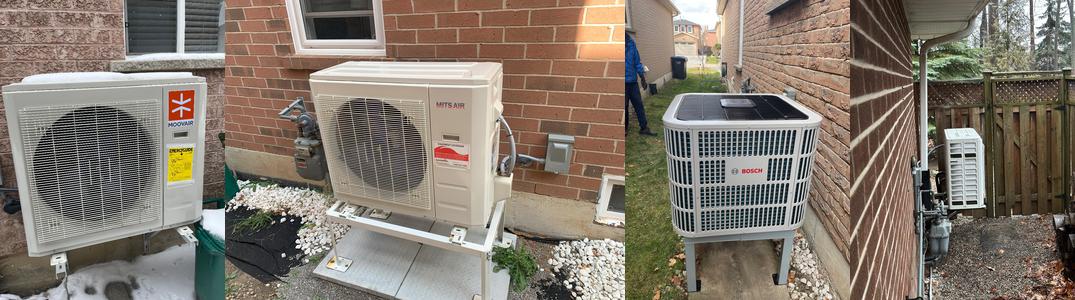
This study analyzed the experiences of six homeowners in The Region of Peel, Ontario, that installed an ASHP to operate with an existing furnace for heating during Winter 2023/2024. Interviews, utility data, surveys, and smart thermostat data were used to assess carbon, cost, and utility savings as well as gather qualitative insights on system implementation and operation.
Five of six homeowners installed CCASHPs. System costs ranged from $4,300 to $8,000 (pre-tax; installed). In most cases, the majority of the upfront costs were covered by the Enbridge Home Efficiency Rebate Plus (HER+) Program, with Enbridge as the Ontario delivery agent for the Canada Greener Homes Grant (CGHG) Program. System sizes ranged from 2- to 3-Tons.
Participants were recruited from December 2022 to Fall/Winter 2023. The analysis focused on Winter 2023/2024 and did not include summertime operation. Due to the timing of the CCASHP installations and subsequent recruitment into this study, the data analysis for each home did not typically encompass the full 2023/2024 heating season. However, the data analysis included more than two-thirds of the heating season for most homes.
Gas and Utility Bill Reductions
Whole-home gas consumption was reduced by 62% to 91% (Figure A) during the data collection periods for each home. The gas used by the furnaces was typically reduced by more than 80%. Most homes were close to break-even on net utility costs at current rates compared to pre-CCASHP utility consumption. The home that installed an ASHP that did not meet the criteria for a CCASHP saw a small utility cost increase as a result.
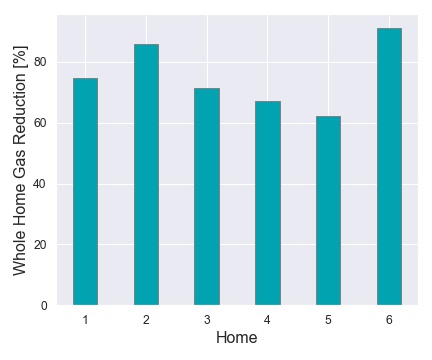
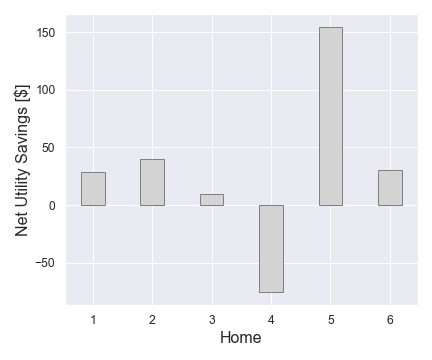
Figure A. (Left) The whole-home gas consumption was reduced by between 62% and 91% during the periods evaluated. (Right) The systems were typically close to break-even on utility costs when compared with furnace-only operation.
Systems are expected to last on the scale of 15 years. Depending on future utility rate escalation, the analysis showed that annual net utility savings may reach hundreds of dollars for some homes during the system lifetime. In 5 of 6 homes, it was estimated or shown that the heat pumps could meet the home heating needs in outdoor temperatures below -10oC.
Homeowner Experience
Homeowners reported being generally satisfied with their heat pumps. They reported that the CCASHPs maintained comfortable indoor temperatures, operated more quietly than the previous A/C units despite longer run times, and resulted in overall utility savings. The study found that:
- All homeowners would recommend heat pumps to others.
- All homeowners found their homes comfortable.
- All homeowners had a positive installation experience.
Many expressed that they would have switched to heat pumps earlier if they had known about them. Homeowners also noted the operational differences between heat pumps and furnaces, emphasizing that heat pumps take longer to increase indoor temperatures.
Operational Lessons Learned
Operational lessons included strategies to mitigate unwanted furnace operation during manual setpoint changes and thermostat setback scheduling, as well as optimizing CCASHP utilization in cold temperatures. A need for intuitive time-of-use electricity rate control integration with the Ecobee thermostat was noted.
Making the Case for CCASHP Replacements of A/C Units
Although the HER+ and CGHG Program were phased out early in 2024, the arguments for replacing A/C units with CCASHPs remain strong. The Canada Greener Homes Loan Program continues to offer no-interest financing and Enbridge has recently announced (July 2024) their Home Efficiency Rebate (HER) program which offers a rebate. The combination of these programs results in some CCASHP options being approximately cost-competitive with conventional A/C systems.
Compared to basic A/C units, CCASHPs often offer enhanced features such as quieter operation, improved cooling efficiency (leading to summertime bill savings), and potentially better dehumidification and temperature control during summer months. This study also demonstrated that installing CCASHPs instead of A/C units mitigates the financial risk from future gas rate increases and offers potentially significant long-term utility cost savings.
In summary, CCASHPs (i) may have minimal incremental upfront cost increases versus conventional A/C given current programs, (ii) offer enhanced features that promote a better user experience, and (iii) safeguard homeowners from future utility rate increases.
This study showed CCASHPs were capable of meeting the large majority of home heating needs, while operating with a high efficiency and providing comfortable indoor temperatures for homeowners. Individual homeowners and government programs alike should consider the multiple benefits of replacing aging air-conditioners with CCASHPs.
About STEP
The Sustainable Technologies Evaluation Program (STEP) is a multi-agency initiative developed to support broader implementation of sustainable technologies and practices within a Canadian context. STEP works to achieve this overarching objective by:
- Carrying out research, monitoring, and evaluation of clean water and low carbon technologies;
- Assessing technology implementation barriers and opportunities;
- Developing supporting tools, guidelines, and policies;
- Delivering education and training programs;
- Advocating for effective sustainable technologies; and
- Collaborating with academic and industry partners through our Living Labs and other initiatives.
Technologies evaluated under STEP are not limited to physical devices or products. They may also include preventative measures, implementation protocols, alternative urban site designs, and other innovative practices that help create more sustainable and livable communities.
STEP also acts as a third-party verifier for the Environmental Technology Verification (ETV) process. ETV provides independent evaluation of new technologies to validate environmental claims so that users, developers, regulators, and other parties can make informed decisions about purchasing, applying, and regulating innovative technologies.
Acknowledgements
Funding support for this project was provided by the Climate Impact Fund, The Atmospheric Fund (TAF), and The Region of Peel. Base funding for STEP projects is also provided by York Region and the City of Toronto.

Notice
The contents of this report do not necessarily represent the policies of the supporting agencies. Although every reasonable effort has been made to ensure the integrity of the report, the supporting agencies do not make any warranty or representation, expressed or implied, with respect to the accuracy or completeness of the information contained herein. Mention of trade names, vendors, or commercial products does not constitute endorsement or recommendation of products or services. This document has been provided in web format to improve accessibility and support compliance with the Accessibility for Ontarians with Disabilities Act (AODA).
Table of Contents
- Background
- Introduction
- Analysis Overview
- Home 1 Results
- Home 2 Results
- Home 3 Results
- Home 4 Results
- Home 5 Results
- Home 6 Results
- Discussion
- Conclusion
- References and Endnotes
1 Background
1.1 Climate Change and Air-source Heat Pumps
Climate change is an existential threat, and scientists agree that the window of time to mitigate its worst potential impacts is rapidly closing. Climate change is caused by carbon emissions from human activities. According to The Atmospheric Fund’s (TAF) most recent carbon inventory for the Greater Toronto and Hamilton Area (GTHA), buildings—both homes and larger structures—are the single greatest source of carbon emissions in the region.1 This is due to the fossil fuels (primarily natural gas in Ontario, but also oil and propane) burned for space and water heating.
Electrically-driven air-source heat pumps (ASHPs) offer a key alternative to traditional heating appliances that rely on fossil fuels. ASHPs have two main advantages that can lead to significant carbon and utility cost reductions. Firstly, since ASHPs are powered by electricity, they can reduce carbon emissions for space heating provided the electricity comes primarily from clean sources.
Secondly, ASHPs are highly efficient. Some models are on the scale of three times more efficient than traditional fossil fuel furnaces or boilers. They achieve this by absorbing renewable heat energy from cold outdoor air. ASHPs are essentially air-conditioners that can operate “in-reverse” to provide heating as well as cooling. They look similar to air-conditioning (A/C) units, connect to the home in a similar way, function on the same physical principles, and share most of the same components.
1.2 Replacing A/C Units with Air-source Heat Pumps
The installation of ASHPs presents a significant opportunity for carbon and lifetime cost savings in existing single-family homes. One particularly relevant approach is to replace aging, centrally-ducted A/C units with ASHPs, especially for those homes with a newer furnace and older A/C unit. When an ASHP is installed alongside a furnace, it is referred to as a hybrid system.
In a typical hybrid system, the ASHP handles all the home’s cooling needs and much of the heating needs, with the fossil fuel furnace operating as back-up heating in colder conditions. There are different control strategies for these systems. Those aiming for maximum carbon emission reduction might prioritize using the ASHP whenever it can provide sufficient heating.
Conversely, those looking to minimize operational costs may use smart controllers that optimize usage between the ASHP and furnace based on factors like outdoor temperature, ASHP efficiency, and time-of-use electricity rates.2
1.3 Hybrid Systems with Cold-climate Air-source Heat Pumps
While conventional ASHP hybrid systems have been around for decades, a new technology has emerged in recent years: hybrid systems that replace the A/C with an inverter-driven cold-climate ASHP (CCASHP). CCASHPs, which first appeared in the 2000s, are a significant development because they better maintain heating capacity and efficiency in more extreme cold temperatures—a limitation of conventional ASHPs.
Until recently, CCASHPs were not available in hybrid systems utilizing an existing fossil fuel furnace. Many of the new CCASHP options that can operate with existing fossil fuel furnaces also now have a more competitive upfront cost than has historically been the case with CCASHP systems.
These developments open new possibilities for efficient low-carbon heating in regions with cold winters and hot summers, making CCASHPs a viable, cost-effective, and environmentally friendly option for a broader range of homeowners.
1.4 Terminology
Note that CCASHPs are a special class of ASHP that meet certain requirements. The requirements may be slightly different depending on the context, whether it be a government rebate program or equipment labelling program.
The requirements concern the ability of the ASHP compressor to operate at different speeds, the overall ASHP efficiency, as well as the efficiency and capacity maintenance at -15oC outdoor temperature. It follows that “CCASHP” has a clear definition in terms of performance requirements.
In this study, five of six systems were CCASHPs as defined in the Canada Greener Homes Grant. Note that the report often refers to the systems collectively as CCASHPs for the sake of simplicity, despite the fact that one system did not meet the requirements to be a CCASHP. This heat pump was inverter-driven, and an improvement on conventional single- or two-stage ASHPs, but it was not a CCASHP.
The term “conventional ASHP” in this report is used for the single- and two-stage ASHPs that have been around for decades. The term “ASHP” may be used to refer to CCASHP or non-CCASHP systems.
2 Introduction
2.1 Study Overview
This study analyzed the data and overall experiences of six homeowners in The Region of Peel, Ontario, including Mississauga, Caledon, and Brampton, that installed a CCASHP to operate with an existing furnace during Winter 2023/2024. Homeowner interviews, pre- and post-installation utility data, and smart thermostat data were used to:
- Calculate the actual carbon, cost, and utility savings from the CCASHP installations; and
- Identify lessons learned regarding system implementation and operation.
2.2 Participating Homes and Compensation
Five of the six participating homes installed a CCASHP that qualified for a $6,500 rebate from the Enbridge Home Efficiency Rebate Plus (HER+) Program. Enbridge was the Ontario delivery agent for the Canada Greener Homes Grant (CGHG) Program. The HER+ Program dispersed the CGHG Program rebate and added an additional rebate. Additionally, these five homes received an extra $1,000 from the study team for participating in the study.
The remaining home joined the study before ASHPs with existing furnaces became eligible for the CGHG rebate (a change that occurred in Spring/Summer 2023) and received a $3,000 incentive from the study team to offset the system’s upfront costs and for their participation in the study.
All homeowners had previously used natural gas furnaces and were provided with Ecobee thermostats to control their hybrid systems.
2.3 Data Collection
As part of the study, homeowners provided the following to the study team:
- Historical gas and electricity bill data for their homes;
- An EnerGuide Audit Report (if available);
- Permission for the study team to read gas and electricity meters approximately monthly, or regular photos of the meters suitable for reading the meters;
- The heat pump installation invoice, including system costs and make/model;
- Information on the existing furnace – make, model, and capacity;
- A photo of the heat pump;
- Additional quotes from different heat pump installers (if applicable);
- Ecobee thermostat login credentials for accessing thermostat data; and
- Participation in a survey or interview regarding their experience and lessons learned related to the heat pump installation and operation.
This study evaluated gas consumption of the homes using direct readings of the gas meter. Note that the volume of gas that is billed to the homeowners may differ by a small amount (<4%) from that which is indicated by the meter. This is because the gas utility may apply a small correction to account for different factors that impact the accuracy of the meter at different locations.
2.4 Homeowner Support
The study team held information sessions and answered homeowner questions related to heat pumps but did not recommend specific contractors, brands, or heat pump models. Contractor and heat pump selection were entirely up to the participating homeowners.
2.5 Timelines
One homeowner was recruited in December 2022, with the remainder being recruited in Fall/Winter 2023. Data analysis considered only Winter 2023/2024. Summertime operation was not included at this time due to project timelines and the fact that most homes did not have a CCASHP in Summer 2023.
3 Analysis Overview
3.1 Estimating Gas Savings and Electricity Increase
The primary goal of the utility bill analysis was to estimate the gas reduction and electricity increase resulting from the heat pump installation. Utility bill data from the gas and electricity utilities were collected for at least one year prior to the heat pump installation. Post-installation, the project team collected gas and electricity meter reading data approximately monthly after the participant joined the study and until the end of April 2024.
Baseline linear regression models of home energy consumption were created from the pre-installation data. These models normalized for weather by determining the relationship between heating degree days (HDDs) and utility consumption for the homes. HDDs are used to quantify the outdoor temperature over long periods of time. The baseline models predicted what the gas and electricity consumption would have been for Winter 2023/2024 without the heat pump installation, based on HDDs.
The predicted baseline consumption was compared against actual utility consumption to estimate gas savings and electricity increases. Home 6 was an exception since the homeowner installed submetering on the heat pump. The submetering data was directly used to determine the electricity consumption of the CCASHP.
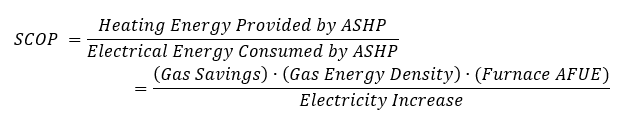
3.2 Estimating Seasonal Coefficient of Performance
The seasonal average coefficient of performance (SCOP) describes the heating energy provided by the CCASHP against the energy it consumed to operate. A key benefit of CCASHPs is that the SCOP can be on the scale of 3. A comparable metric for furnaces is the annual fuel utilization efficiency (AFUE) which cannot exceed a value of 1. In other words, CCASHPs can be approximately three times more efficient than a furnace.
An approximate SCOP was calculated from the gas savings and electricity increase using the equation below. A gas energy density of 10.36 kWh/m³ was assumed. Gas savings and electricity increase were calculated based on the approach outlined in Section 3.1.
This calculation is strictly valid only in homes where the CCASHP installation was the sole significant energy efficiency measure. While some homes implemented additional smaller measures, the SCOP calculation may not be strictly valid in these cases as a portion of the changes in utility consumption could be attributed to these other measures.
Nonetheless, the SCOP was still calculated for these homes to provide a high-level check that the gas savings were consistent with the electricity consumption increase.
This study did not consider cooling season operation.
3.3 Gas Rate Assumptions
The utility costs were evaluated by applying a gas rate to the gas savings, and an electricity rate to the electricity increase. Historical gas rate data was obtained from Ontario Energy Board.3 Gas rates in Ontario change quarterly and include multiple line items. Fixed costs of maintaining a gas connection were ignored but all other line items (including the Federal Carbon Charge and HST) were considered.
The rates for October 2023 and January 2024 were averaged to create an estimated gas rate of 0.479 $/m3 for the period considered in this study. Note that 0.14 $/m3 is due to the Federal Carbon Charge (including HST). The schedule for the Federal Carbon Charge indicates this charge will increase to 0.37 $/m3 (including HST) by 20304 but government policy is subject to change. Also note that gas rates are volatile and have exceeded 0.60 $/m3 in the recent past.5
3.4 Electricity Rate Assumptions – Weighted Time-of-Use Rate
The electricity rate used to calculate cost savings in 5 of 6 homes was based on weighted time-of-use (TOU) rates. Internal analysis from STEP has suggested that the heating needs of a home are allocated approximately two-thirds to an off-peak TOU, and the remainder being approximately equally split between mid-peak and peak-TOU. This breakdown aligns with hours spent in each TOU bracket over the course of a week. Different homes may deviate from this breakdown, but data was not available to offer a more refined estimate for each specific home considered in this study.
A TOU-weighted rate was determined using the OEB Bill Calculator.6 Electricity rates are complex, with both fixed costs and many line items that are proportional to the kWh consumption. The OEB Bill Calculator provides a simple method to determine an overall electricity rate.
For an Alectra-Enersource service area, two sample bills were calculated with TOU breakdown listed above and with 100 kWh difference in consumption. The difference in cost divided by the difference in consumption is the TOU-weighted marginal electricity rate that includes all line items, but neglects fixed costs. The TOU-weighted marginal electricity rate was determined to be 0.137 $/kWh. This is shown in Figure 1.
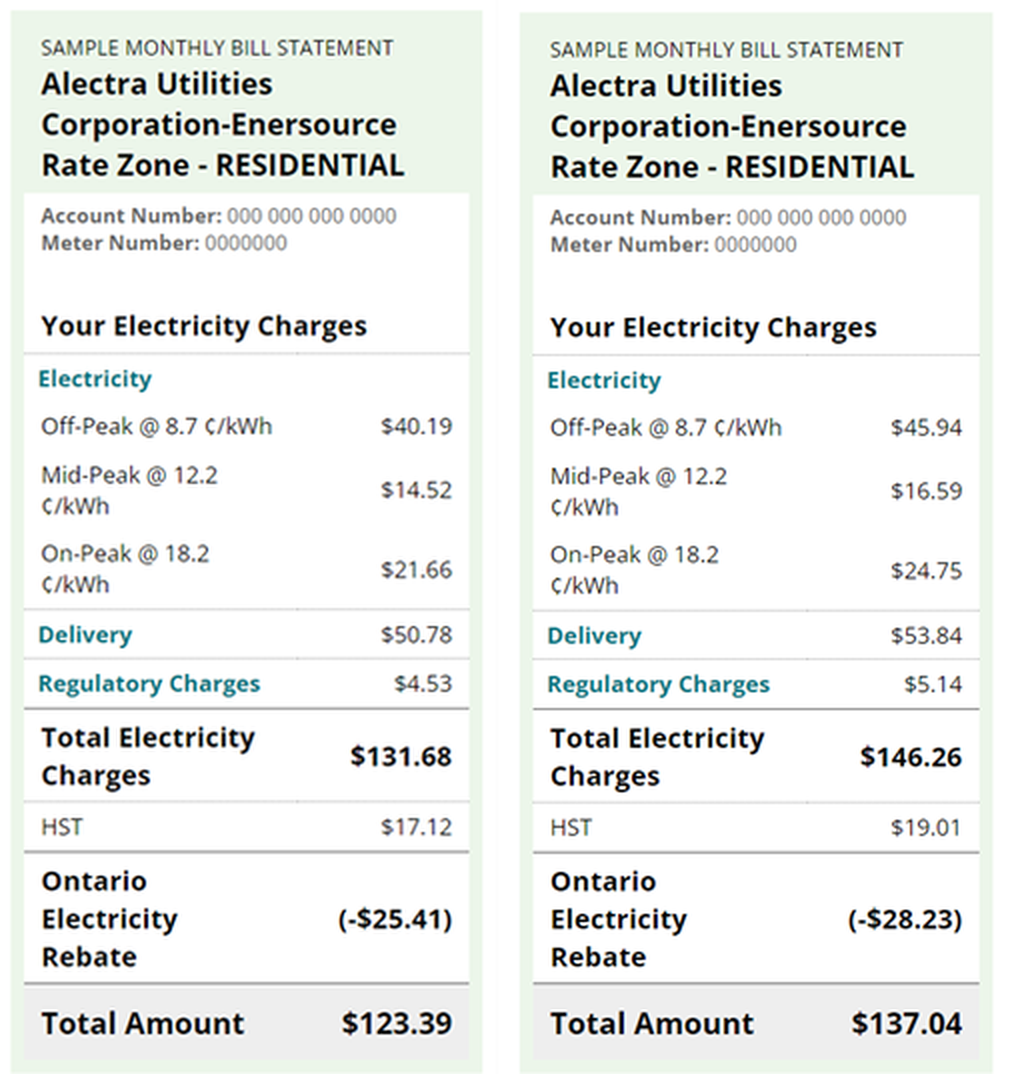
Figure 1. The weighted marginal TOU rate was determined by calculating sample bills with the OEB Bill Calculator. The left bill shows the total cost for 700 kWh, and the right bill shows the cost for 800 kWh. The additional 100 kWh for the right bill came at a rate of 13.7 $/kWh. Note that the resulting rate is approximately the same regardless of the kWh increase.
3.5 Electricity Rate Assumptions – Ultra-low Rate Structure
One homeowner was on the Ultra-Low Overnight (ULO) rate structure (Figure 2) and had additional submetering on the heat pump that measured its hourly electricity consumption. To determine the electricity cost in this home, the following equations were used:
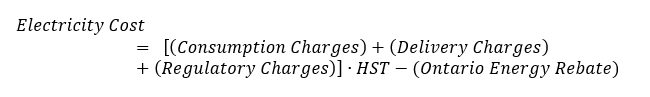
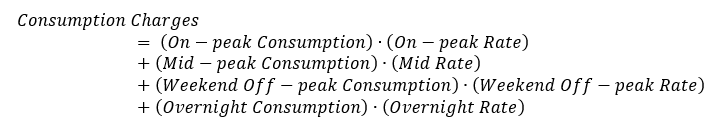


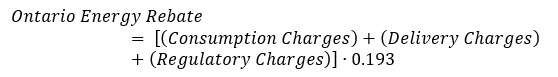
Figure 2. The ULO rate structure for the time period considered in this analysis is shown.
Table 1. Assumptions used to determine the electricity cost for the homeowner that used the ULO rate structure.
| Parameter | $/kWh |
| On Peak Rate | 0.286 |
| Mid-peak Rate | 0.122 |
| Weekend Off-peak Rate | 0.087 |
| Overnight Rate | 0.028 |
| Delivery Rate* | 0.0306 |
| Regulatory Rate* | 0.0061 |
3.6 Considering Future Rates
Utility rates will change over the system’s expected 15-year lifetime. These changes are driven by multiple unpredictable factors. To understand the impact of potential future rates, different utility rates were applied to the gas savings and electricity increase for Winter 2023/2024 to determine net savings or cost under different scenarios. No additional modeling was done to predict savings under different weather conditions in other years.
This analysis assumed that CCASHP control parameters would remain unchanged across different utility rate scenarios. While this simplifies the analysis, it overlooks a key financial benefit of hybrid systems—flexibility. If future rates make operating the CCASHP less cost-effective, controls can be adjusted to optimize utility costs by reducing CCASHP usage if desired.
3.7 Emission Factor Assumptions
The carbon impacts were calculated by applying emission factors to the gas decrease and electricity increase. The gas emission factor was 1,927 g CO2e per m3.7 The electricity emission factor was 71 gCO2e per kWh. This is the forecasted annual emission factor (AEF) for 2024 from recent analysis by The Atmospheric Fund in their report “Ontario Electricity Emissions Factors and Guidelines: June 2024 Edition.”8 Due to lack of marginal emission factor data, the forecasted AEF is recommended as a proxy for the long-term marginal emission factor.
3.8 Interviews
To assess CCASHP performance qualitatively, the homeowners were interviewed on their experience with the hybrid system over the heating season. They were given the option to answer the questions over a phone call or in written form. Three out of six homeowners responded to the interview questions over the phone and two of six provided written responses. One homeowner did not respond to the request for an interview.
Example questions asked for the interviews are listed below. During interviews, these questions provided a general structure. However, the interviews were conversational in tone and explored additional topics as was relevant.
- Were you satisfied with your choice of heat pump?
- Would you have done anything differently?
- How was your installation experience with the contractor?
- Have there been any noticeable differences between the heat pump and previously with furnace for heating?
- Have you seen a difference in your utility bills?
- Was your home comfortable?
- Would you recommend heat pumps to others?
- Were there any other factors (like other home energy efficiency improvements) that may have caused a difference in home energy consumption after the CCASHP was installed?
3.9 Ecobee Data
Ecobee thermostat data was available at 5-minute intervals. This data included outdoor temperature, indoor temperature, temperature setpoint, duration of CCASHP operation, and duration of furnace operation, among other parameters. The data was visualized in various ways to understand the conditions triggering the back-up furnace and potential causes. Additionally, it was used to evaluate heat pump control optimization by examining the duration of CCASHP operation before reverting to the back-up furnace.
4 Home 1 Results
4.1 Home Overview
Table 2 provides an overview of Home 1, and Figure 3 shows a picture of the installation. The homeowner did not report any other home energy retrofits, or other factors, that could have influenced the utility comparison before and after the ASHP was installed.
Table 2. Home 1 Overview
| Location | Mississauga |
| Above Grade Conditioned Floor Area | 1,637 ft2 |
| Year Constructed | 1985 |
| Type | Detached; 2-storey |
| EnerGuide Audit Design Heat Loss | 11.9 kW; 40.5 kBTU/hr |
| ASHP Installation Date | 11/22/2023 |
| ASHP Make/Model | Bosch; BOVA-36-HDN1-M20G |
| AHRI # | 203025008 |
| Nominal ASHP Size | 3 Ton |
| Region IV ASHP HSPF/HSPF2 | 10/9 |
| Installed Cost (Pre-tax; Pre-rebate) | $7,257 |
| ASHP Rebate | $6,500 (CCASHP) |
| Furnace Make/Model | Carrier 59SC2D060 (1-stage) |
| Furnace AFUE | 92.1% |
| Furnace Heating Output | 56 kBTU/hr |
4.2 Utility Bill Analysis
Figure 4 (upper row) shows the gas and electricity consumption plotted against HDDs for both the pre- and post-installation periods. Since each data point does not exactly represent 1-month of utility data (for example, one data point might represent 32 days, and the next represents 27 days), HDDs and consumption has been divided by the number of days represented.
The fit lines define the baseline models of utility consumption. The models predict the gas or electricity consumption based on the number of HDDs and the number of days in any given period. Using post-installation HDDs, the baseline consumption was calculated and compared against actual consumption on an approximately monthly basis (bottom row). Seasonal totals are provided in Table 3.
Figure 4. (Top Left) The gas consumption of the home vs. HDDs is plotted before and after the CCASHP was installed, showing a substantial gas decrease. (Top Right) The electricity consumption of the home is plotted against HDDs before and after the CCASHP installation, showing an increase. (Bottom Left) The gas consumption baseline model was used to predict baseline gas consumption on an approximately monthly basis, and this was compared against the actual consumption. (Bottom Right) The electricity consumption baseline model was used to predict the baseline electricity consumption on an approximately monthly basis, and this was compared against actual consumption.
Table 3. Seasonal summary of utility bill analysis
| General | |
| Period Analyzed Post-Installation | 11/24/2023 – 4/24/2024 |
| Gas Consumption | |
| Modelled Total Baseline Gas Consumption | 1,101 m3 |
| Modelled Baseline Space Heating Gas Consumption | 1,021 m3 |
| Actual Gas Consumption | 278 m3 |
| Gas Reduction | 823 m3 |
| Relative Gas Reduction (Whole Home) | 75% |
| Relative Gas Reduction (Space Heating) | 81% |
| Electricity Consumption | |
| Modelled Baseline Electricity Consumption | 2,606 kWh |
| Actual Electricity Consumption | 5,272 kWh |
| Electricity Increase | 2,666 kWh |
| Carbon | |
| Carbon Reduction | 1.4 T CO2e |
| Utility Cost Change | |
| Net Utility Cost Savings at Current Rates (- for increases; + for savings) | +$29 |
| Performance | |
| Estimated COP (Based on Utility Changes) | 2.9 |
4.3 Furnace and Heat Pump Operation
Figure 5 shows how much furnace heating was used as a function of the outdoor temperature, and as time progresses throughout the heating season. Blocks of colour indicate that the corresponding outdoor temperature on the vertical axis occurred during that given day. The colour of the block indicates how often the furnace was on for outdoor temperatures occurring within that block. The dark blue colour indicates no furnace operation.
From this plot, it is clear that thermostat settings had been changed over the course of the heating season. There was a cold snap in January and the furnace started turning on when outdoor temperatures were below -5oC. There was a subsequent cold snap in February when the heat pump was operating in much colder temperatures below -5oC. The “Compressor Min Outdoor Temperature” setting may have been adjusted from its original setting to allow the CCASHP to operate in colder conditions.
Figure 5. The furnace operation from the Ecobee data is shown both as a function of outdoor temperature and as time progressed over the heating season.
In Figure 6, the Ecobee data has been aggregated on a 3-hour interval and filtered to include only nighttime operation and those time periods where the furnace did not operate. Time periods where the setpoint changed from the previous interval were also filtered out. It shows that by the time the furnace was turning on (below -10oC after January 2024), it had been operating nearly 100% of the time to meet the heating load. This suggests that the heat pump is nearly optimized in terms of its utilization and could not manage the heating of the home in temperatures much colder than it currently does.
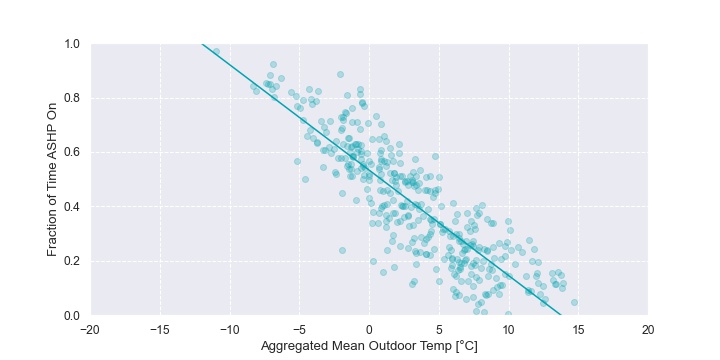
Figure 6. The Ecobee data was aggregated and filtered to evaluate the amount of time it was on as a function of the outdoor temperature. For Home 1, it was on nearly 100% of the time before the furnace needed to turn on to begin heating, suggesting that heat pump utilization is optimized for this home.
Figure 7 shows the heat pump meeting setpoints operating over 12 hours of operation in cold conditions. This home uses thermostat setback. Overnight, the thermostat has a setpoint of 20oC (but it varied over the season) which then rose to 22oC at the start of the day. In outdoor temperatures of -7oC, the heat pump was keeping the home between 19.5 and 20oC consistently and did not need to be on 100% of the time to do it.
The heat pump then turned on approximately 2.5 hours in advance of the programmed morning setpoint increase and this was enough time to meet the new setpoint. The heat pump then maintained the indoor temperature between 21.5 and 22 oC. The homeowners then reduced the setpoint approaching noon. It is not plotted here, but the furnace did not turn on during this time. Overall, this home effectively used a thermostat setback schedule that did not require the furnace to engage.
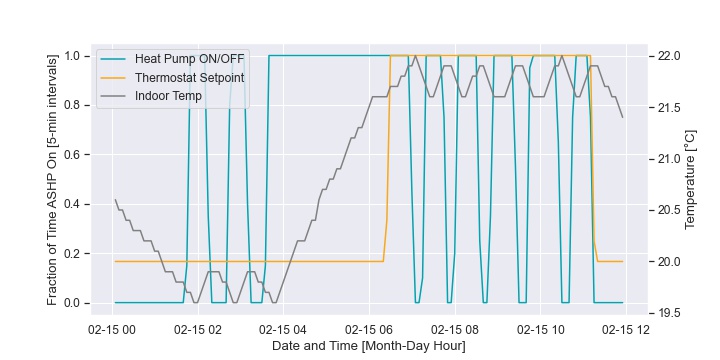
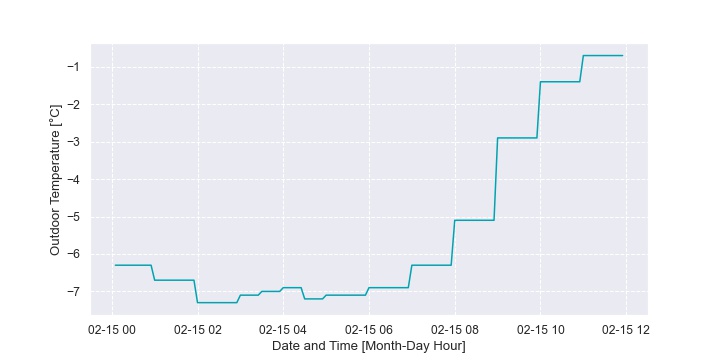
Figure 7. (Top) Example heat pump operational data over 12 hours in February 2024, illustrating the heat pump meeting the indoor setpoint. (Bottom) Outdoor temperature data spanning the same time period.
4.4 Future Net Savings Analysis
In Figure 8, different utility rates were assigned to the gas savings and electricity increase provided in Table 3. This was used to estimate the net cost impacts for different utility rate scenarios that might occur over the system lifetime.
In scenarios without carbon pricing and low gas costs, the system as currently configured would result in a net cost increase. This increase could be mitigated (or eliminated) by adjusting the heat pump controls. If the current carbon pricing schedule continues as planned, and all else is equal, then net annual savings may reach a value on the scale of a few hundred dollars within the system lifetime. It is important to note that this analysis did not consider operation in October and much of November for this home since the CCASHP had not yet been installed.
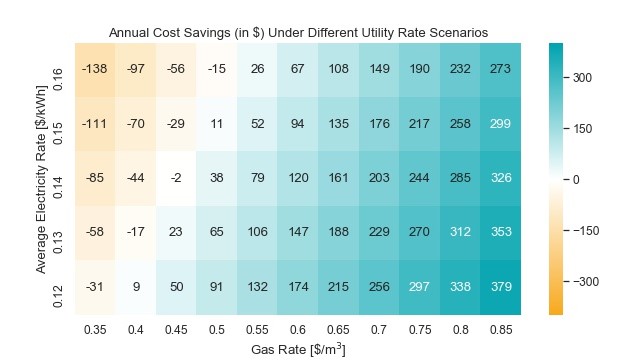
Figure 8. The net annual utility cost increase or decrease was calculated for different potential utility scenarios that might occur over the system lifetime. Positive values are savings and negative values are increases.
4.5 Homeowner Experience
The homeowner reported an overall positive experience with their heat pump system. Their home was comfortable throughout the winter and the beginning of the summer.
“I noticed that the heat pump was a bit noisier than running the furnace during the winter but not much louder. The heat pump does take longer to heat the house (compared to the furnace) so tends to run for longer than if I were to use only the furnace.”
The homeowner reported a great experience with their contractor. They said they were satisfied with their choice of heat pump and would recommend others to install one as well. There was a significant decrease in gas consumption and the electricity bill increased, but the homeowner reported that there have been total savings on the combined utility bills.
The homeowner said: “I think with the energy savings and the environmental benefits the heat pump is a great option…I am glad we installed the heat pump!”
5 Home 2 Results
5.1 Home Overview
Table 4 provides an overview of Home 2, and Figure 9 shows a picture of the installation. In addition to the CCASHP, the homeowner concurrently installed an on-demand gas water heater. Aside from this upgrade, the homeowner did not report any other home energy retrofits, or other factors, that could have influenced the utility comparison before and after the CCASHP was installed.
Table 4. Home 2 Overview
| Location | Bolton (Caledon) |
| Above Grade Conditioned Floor Area | 1,202 ft2 |
| Year Constructed | 2005 |
| Type | Semi-detached; 2-storey |
| EnerGuide Audit Design Heat Loss | 10.4 kW/35.5 kBTU/hr |
| ASHP Installation Date | 11/27/2023 |
| ASHP Make/Model | Moovair; DMA24HOS20230E7 |
| AHRI # | 212361759 |
| Nominal ASHP Size | 2 Ton |
| Region IV ASHP HSPF/HSPF2 | 9.5/9.5 |
| Installed Cost (Pre-tax; Pre-rebate) | $8,033 (Included Energy Audit, ASHP, and a Navien 210s2 tankless water heater) |
| ASHP Rebate | $6,500 (CCASHP) |
| Furnace Make/Model | Lennox; G41UF-36B-070-02 (1-stage) |
| Furnace AFUE | 90% |
| Furnace Heating Output | 66 kBTU/hr |
5.2 Utility Bill Analysis
Home 2 joined the study late and meter readings from the team were limited to 2 months of operation from February 26th, 2024, to April 26th, 2024. Figure 10 shows the same set of plots that was shown in Figure 4 for Home 1. Table 5 shows the full results for the 2-months analyzed. Note that the table includes the impacts of both the water heater upgrade and the CCASHP, but the water heater impacts are much smaller in comparison, estimated to comprise less than 20 m3 of the savings.
Figure 10. In the top row, utility consumption for Home 2 is shown as a function of HDDs pre- and post-installation. The fit lines are models that were used to create the baseline utility consumption in the bottom row.
Table 5. Seasonal summary of utility bill analysis
| General | |
| Period Analyzed Post-Installation | 2/26/2023 – 4/26/2024 |
| Gas Consumption | |
| Modelled Total Baseline Gas Consumption | 429 m3 |
| Modelled Baseline Space Heating Gas Consumption | 351 m3 |
| Actual Gas Consumption | 60 m3 |
| Gas Reduction | 369 m3 |
| Relative Gas Reduction (Whole Home) | 86 % |
| Relative Gas Reduction (Space Heating) | 100 % |
| Electricity Consumption | |
| Modelled Baseline Electricity Consumption | 708 kWh |
| Actual Electricity Consumption | 1,708 kWh |
| Electricity Increase | 1,000 kWh |
| Carbon | |
| Carbon Reduction | 0.7 T CO2e |
| Utility Cost Change | |
| Net Utility Cost Savings at Current Rates (- for increases; + for savings) | +$39 |
| Performance | |
| Estimated COP (Based on Utility Changes) | 3.3* |
5.3 Furnace and Heat Pump Operation
Figure 11 shows how much furnace heating is used as a function of the outdoor temperature, and as time progressed throughout the heating season. The Ecobee data was available starting late 2023. Initially, there was some limited level of furnace operation in milder conditions. However, after January 2024, the furnace was effectively on only when the outdoor temperature dropped below -8oC.
Figure 11. The furnace is on sporadically in milder conditions in January 2024. However, after that, the furnace only tends to turn on when the outdoor temperature drops below -8oC.
In Figure 12, the Ecobee data has been aggregated on a 4-hour interval and filtered to include only nighttime operation and those time periods where the furnace did not operate. Time periods where the setpoint changed from the previous interval were also filtered out. It shows that by the time the furnace was turning on (below -8oC), it had been operating nearly 80% of the time to meet the heating load. This suggests that the heat pump may still have unutilized capacity that could push it to manage the home heating in slightly colder temperatures.
Figure 12. The CCASHP was on approximately 80% in an outdoor temperature of -8oC, prior to reverting to the gas back-up furnace. The CCASHP may have a small amount of unused heating capacity that could allow it to heat the home in slightly colder conditions such that it was operating 100% of the time before reverting to the furnace.
Figure 13 shows 12-hours of heat pump operation in cold conditions. With overnight temperatures of -6 to -8oC, the CCASHP was effectively maintaining the indoor setpoint at 22oC. The homeowner then increased the indoor setpoint to 24oC in the morning. This appeared to be a manual change that happened regularly but not every day. At the same time, the outdoor temperature continued to drop.
The heat pump began heating but the furnace ultimately kicked in to meet the new setpoint. The furnace did not stay on until the new setpoint was met but instead the heat pump turned on again when the indoor temperature was closer to setpoint. It maintained a temperature near 23oC but appeared unable to meet a 24oC setpoint. The homeowner then dropped the setpoint to 21oC.
This provides insight into why the furnace was sometimes on in milder conditions in Figure 11. The homeowner makes regular manual thermostat changes between 20 oC and 24 oC, and this causes the furnace to turn on to meet larger thermostat setpoint increases. This contrasts with Home 1, where a pre-programmed thermostat setpoint allowed the heat pump to turn on in advance of a setpoint change without requiring the furnace to turn on.
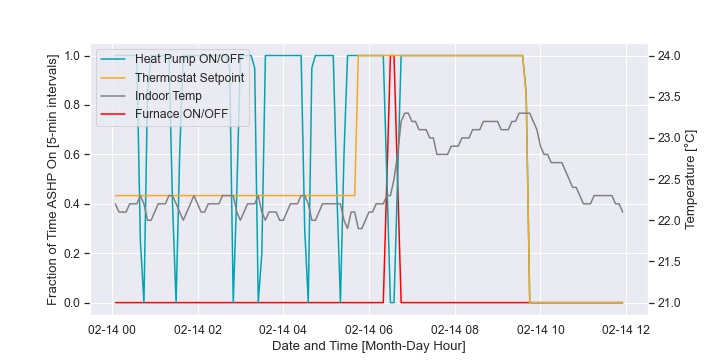
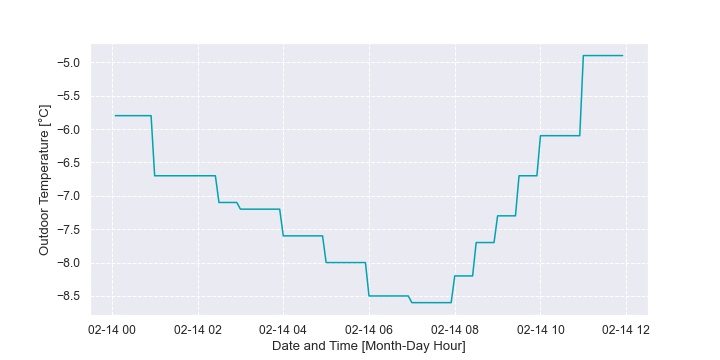
Figure 13. (Top) Example heat pump operational data over 12 hours in February 2024, illustrating the heat pump and furnace operation in response to manual setpoint changes. (Bottom) Outdoor temperature spanning the same period.
5.4 Future Net Savings Analysis
For this home, this portion of the analysis is limited since it only includes two months of operational data. However, it is nonetheless still of value. Figure 9 shows the savings in different utility rate scenarios. If there is low-cost gas and very expensive electricity, then operating the CCASHP as the exclusive heating source for these two months would result in a slight cost increase. However, a savings approaching $200 may also be possible in the future if carbon pricing continues its current schedule and all else remains the same.
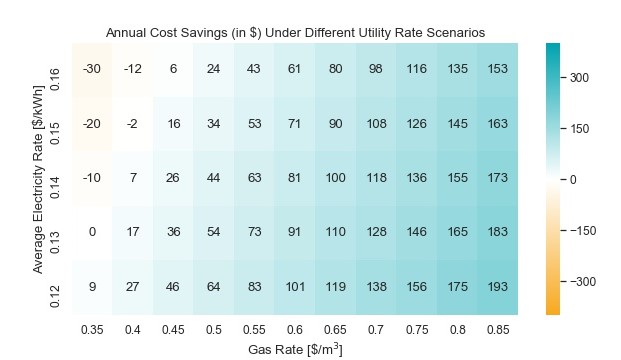
Figure 14. The net cost savings for two months of CCASHP operation in Home 2 was evaluated for different potential utility rate scenarios.
5.5 Homeowner Experience
The homeowner rated their overall experience with the heat pump at 7.5 out of 10. They reported no issues with noise, a great installation experience, and were overall happy with their system. The homeowner was new to heat pump systems and was not prepared for a different heating experience compared to a conventional furnace.
They stated “I was not prepared for how the heating functions…It constantly pumps warm air versus the furnace which really pushes hot air. It’s a different technology I would say and the person getting the heat pump needs to be prepared for this.”
The homeowner reported that the hydro bill almost doubled, but they predicted approximately 15% to 20% overall savings with their total utility bills over the heating season. The homeowner had a positive experience with the heat pump in cooling mode, saying: “I’m happy, the cooling mode is amazing.”
After doing some research, the homeowner reported that he might have gotten a larger capacity heat pump to heat his home at a faster rate and reduce runtimes. However, it should be noted that longer runtimes should be expected with ASHP systems. Overall, the homeowner was satisfied with their heat pump and would recommend the system to others if there are rebates available, “I’m satisfied. It’s an amazing unit…It’s a good thing to have for sure.”
6 Home 3 Results
6.1 Home Overview
Table 6 provides an overview of Home 3, and Figure 15 shows a picture of the installation. The homeowner also installed an EV charger in early March 2024. This would have contributed to the electricity increase and ultimately served to reduce the calculated savings and SCOP. However, no corrections were made because of insufficient data and the fact the charger install happened at the end of the analysis period. Aside from this upgrade, the homeowner did not report any other factors that could have influenced the utility comparison before and after the CCASHP was installed.
Table 6. Home 3 overview
| Location | Mississauga |
| Above Grade Conditioned Floor Area | 2,046 ft2 |
| Year Constructed | 1998 |
| Type | Detached; 2-storey |
| EnerGuide Audit Design Heat Loss | 12.1 kW/41.3 kBTU/hr |
| ASHP Installation Date | 7/18/2023 |
| ASHP Make/Model | Mitsair; MOD30U-30HFN1-MR0(X) |
| AHRI # | 211911382 |
| Nominal ASHP Size | 2.5 Ton |
| Region IV ASHP HSPF/HSPF2 | 9.5/9.7 |
| Installed Cost (Pre-tax; Pre-rebate) | $7,718 |
| ASHP Rebate | $6,500 (CCASHP) |
| Furnace Make/Model | Goodman; GMEC960803BN (2-stage) |
| Furnace AFUE | 96% |
| Furnace Heating Output | 76.88 kBTU/hr (high) and 53.82 kBTU/hr (low) |
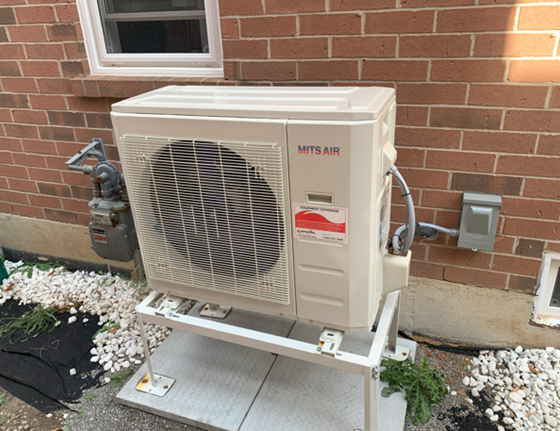
Figure 15. Home 3 heat pump.
6.2 Utility Bill Analysis
The top row of Figure 16 shows the pre- and post-installation utility data versus HDDs. The fit lines provide a model used to determine the baseline energy consumption of the homes, against which the actual pre- and post-retrofit utility consumption could be compared (bottom row).
Figure 16. In the top row, utility consumption for Home 3 is shown as a function of HDDs pre- and post-installation. The fit lines are models that were used to create the baseline utility consumption shown in the bottom row of plots.
Table 7. Seasonal summary of utility analysis for Home 3
| General | |
| Period Analyzed Post-Installation | 11/15/2023 – 4/26/2024 |
| Gas Consumption | |
| Modelled Total Baseline Gas Consumption | 1,690 m3 |
| Modelled Baseline Space Heating Gas Consumption | 1,518 m3 |
| Actual Gas Consumption | 486 m3 |
| Gas Reduction | 1,204 m3 |
| Relative Gas Reduction (Whole Home) | 71 % |
| Relative Gas Reduction (Space Heating) | 79 % |
| Electricity Consumption | |
| Modelled Baseline Electricity Consumption | 2,159 kWh |
| Actual Electricity Consumption | 6,296 kWh |
| Electricity Increase | 4,137 kWh |
| Carbon | |
| Carbon Reduction (Annual EF) | 2.1 T CO2e |
| Utility Cost Change | |
| Net Utility Cost Savings at Current Rates (- for increases; + for savings) | +$10 |
| Performance | |
| Estimated COP (Based on Utility Changes) | 2.9 |
6.3 Furnace and Heat Pump Operation
Figure 17 shows how much furnace heating is used as a function of the outdoor temperature, and as time progressed throughout the heating season. Once the outdoor temperature dropped below approximately -4oC, the furnace was used but otherwise it is predominately the CCASHP.
Figure 17. The furnace only tended to turn on when the outdoor temperature dropped below approximately -4oC.
In Figure 18, the Ecobee data has been aggregated on a 12-hour interval and filtered to include only periods where the furnace did not operate and the setpoint did not change from the previous interval. The heat pump typically operates less than 60% of the time, suggesting there is unutilized capacity.
Figure 18. The fraction of time that the heat pump is on is plotted against outdoor temperature to investigate if there is unutilized heating capacity from the heat pump. Since the heat pump is only on 60% of the time before reverting to the furnace, there is likely significant unutilized heat pump capacity. The fit line is a guide to the eye and the prediction that 100% heat pump operation would occur at -20oC is very likely an optimistic evaluation. It does seem likely that the heat pump may be able to manage the heating needs of the house in outdoor temperatures near -10oC or slightly colder.
The 12-hour aggregation period was needed to see the relationship in Figure 18 because this home has atypical behaviour. This is shown in Figure 19, providing operation data over a 24-hour period. Below an outdoor temperature of -4oC, the thermostat reverts immediately to the furnace and does not operate the heat pump. This is likely because of the value used for the “Compressor Min Outdoor Temperature” in the Ecobee which prevents the Ecobee from calling for the heat pump below a preset temperature.
Interestingly, whenever there is a heating call (for furnace or heat pump) the thermostat sees a drop in temperature on the scale of 1.5oC. Similarly, the setpoint temperature is overshot by both furnace and heat pump to a much greater degree than in other homes. The temperature continues to warm even after the heating equipment is off. This forces the heat pump to operate with very long on/off cycles, requiring the longer aggregation interval for Figure 18.
The research team speculates that this is related to thermostat placement. The thermostat is located on an interior wall of the home and the homeowner said there is return air flowing directly in the wall behind the thermostat. This may cause issues with the thermostat readings if the air pulled from a different area of the house is warmer or cooler. The overshot may be explained by the air balancing in the home such that the heat pump provides excess heat to other areas of the home that takes time to dissipate before it is registered at the thermostat. The home may benefit from air balancing or installing external temperature sensors to better regulate the home’s overall temperature.
Figure 19.(Top) Heat pump and furnace operation are shown over 24 hours in February 2024. (Bottom) Outdoor temperature data spanning the same period.
6.4 Future Net Savings Analysis
In Figure 20, different electricity and gas rates were applied to the electricity increase and gas savings provided in Table 6 to determine the impact of different utility rate scenarios on the net utility costs. Depending on future rates, there may be a savings or an increase. As stated previously, the system controls can be reconfigured (if desired) to ensure limited or no increases to operating costs in the face of changing utility rates.
Figure 20. The net utility cost impacts were evaluated for different potential utility rate scenarios.
6.5 Homeowner Experience
The homeowner stated, “It’s working great. It’s performing perfect….” when asked about their overall experience with the heat pump. They also reported a great installation experience with their contractor, comfortable temperatures in their home, and no noise issues. The homeowner reported that they did not see much overall net difference in their utility bills.
This is one of the homes that had the unit installed for part of Summer 2023. It is difficult to compare cooling mode since this home did not have an A/C unit before installing the heat pump. The homeowner stated that the upper floor does not get as cool as they’d like in the summertime, however this may be because of the existing ductwork in the house.
To keep cool overnight, they have installed blackout blinds on their bedroom windows. They also found the Ecobee thermostat to be less intuitive to operate compared to their previous thermostat. When asked if they would have done anything differently, they mentioned “We wouldn’t have waited so much time to do it…I would be less hesitant to jump in.”.
7 Home 4 Results
7.1 Overview
Table 8 provides an overview of Home 4, and Figure 21 shows a picture of the installation. Around the time of the CCASHP installation, the homeowner also replaced the gas stove and dryer with electric options. The change in consumption from these upgrades is estimated to be small compared to changes from the CCASHP, and no corrections were made to the utility bill analysis to account for them. The homeowner did not report any other home energy retrofits, or other factors, that could have influenced the utility comparison before and after the CCASHP was installed.
| Location | Mississauga |
| Above Grade Conditioned Floor Area | 1,500 – 2,000 |
| Year Constructed | 1976 |
| Type | Semi-detached; Back-split |
| EnerGuide Audit Design Heat Loss | n/a |
| ASHP Installation Date | 12/15/2022 |
| ASHP Make/Model | York; HMH72B241S |
| AHRI # | AHRI # applies to a specific combination of ASHP and indoor coil, but information on indoor coil was not available. Invoice indicates it was a 2.5 Ton uncased coil. |
| Nominal ASHP Size | 2 Ton |
| Region IV HSPF2 | 7.5 |
| Installed Cost (Pre-tax; Pre-rebate) | $4,300 |
| ASHP Rebate | n/a (Not a CCASHP) |
| Furnace Make/Model | Amana; AMVC9608003BNAA (2-stage) |
| Furnace AFUE | 96% |
| Furnace Heating Output | 76.9 kBTU/hr (high); 53.8 kBTU/hr (low) |
Figure 21. Home 4 heat pump photo.
7.2 Utility Bill Analysis
The top row of Figure 22 shows the pre- and post-installation utility data versus HDDs. The fit lines provide a model used to determine the baseline energy consumption of the homes, against which the actual pre- and post-retrofit utility consumption could be compared (bottom row).
Figure 22. In the top row, utility consumption for Home 4 is shown as a function of HDDs pre- and post-installation. The fit lines are models that were used to create the baseline utility consumption in the bottom row of plots.
Table 9. Seasonal summary of utility analysis for Home 4
| General | |
| Period Analyzed Post-Installation | 9/19/2023 – 4/26/2024 |
| Gas Consumption | |
| Modelled Total Baseline Gas Consumption | 1,506 m3 |
| Modelled Baseline Space Heating Gas Consumption | 1,313 m3 |
| Actual Gas Consumption | 493 m3 |
| Gas Reduction | 1,013 m3 |
| Relative Gas Reduction (Whole Home) | 67 % |
| Relative Gas Reduction (Space Heating) | 77 % |
| Electricity Consumption | |
| Modelled Baseline Electricity Consumption | 3,649 kWh |
| Actual Electricity Consumption | 7,742 kWh |
| Electricity Increase | 4,093 kWh |
| Carbon | |
| Carbon Reduction (Annual EF) | 1.7 T CO2e |
| Utility Cost Change | |
| Net Utility Cost Savings at Current Rates (- for increases; + for savings) | -$75 |
| Performance | |
| Estimated COP (Based on Utility Changes) | 2.5 |
7.3 Furnace and Heat Pump Operation
Figure 23 shows the furnace operation over Winter 2023/2024. It effectively only turns on below -10oC, which happened rarely. The homeowner reported that the heat pump was configured to turn on the gas back-up heating when it entered defrost mode.
Defrost occurs occasionally in cold conditions when the heat pump actively heats up its outdoor coil to remove any frost that has accumulated. The homeowner did not want the furnace to turn on in these conditions but could not determine a solution to prevent it from happening.
The control decision to turn on the furnace occurred downstream of the Ecobee so the furnace operation in defrost more did not register in Figure 23. This explains why the furnace appeared to operate very little in Figure 23, but Table 9 indicates that the furnace gas consumption was only reduced by 77%.
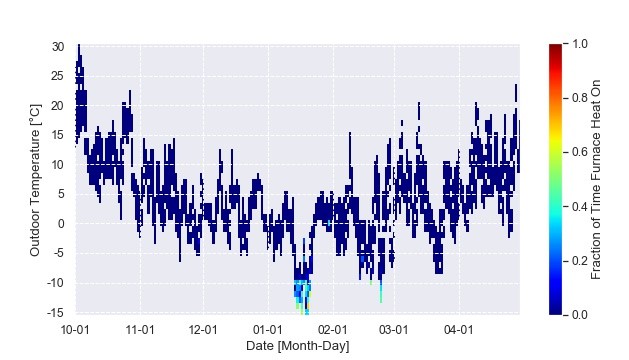
Figure 23. A time-series heat map shows when the furnace was operating in different outdoor temperatures through the course of the 2023/2024 heating season.
Figure 24 shows how frequently the heat pump was on with respect to outdoor temperature. This data was aggregated on a 3-hour basis and filtered to only include overnight operation, time periods when the furnace was off, and time periods where the setpoint did not change from the previous period. At most, the ASHP was operating 85% of the time when it was used as the source of heating. This suggests that there is a small amount of unutilized heating capacity that could allow the heat pump to heat the home sufficiently in slightly conditions than it was used for.
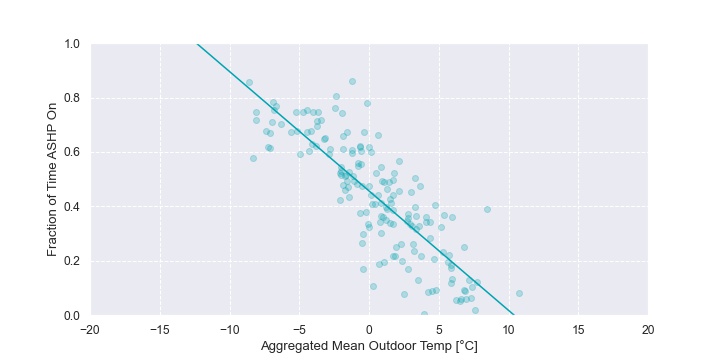
Figure 24. The fraction of time that the heat pump is on is plotted against outdoor temperature to investigate if there is unutilized heating capacity from the heat pump. The heat pump is on as much as 85% of the time before reverting to the furnace. The heat pump may sometimes be able to heat the home in slightly colder conditions than it was used for.
Figure 25 shows Ecobee data from 12 hours of operation during February 2024. The ASHP was used to meet the heating setpoint in cold conditions. When the setpoint was increased, it triggered the furnace to turn on for a short period of time.
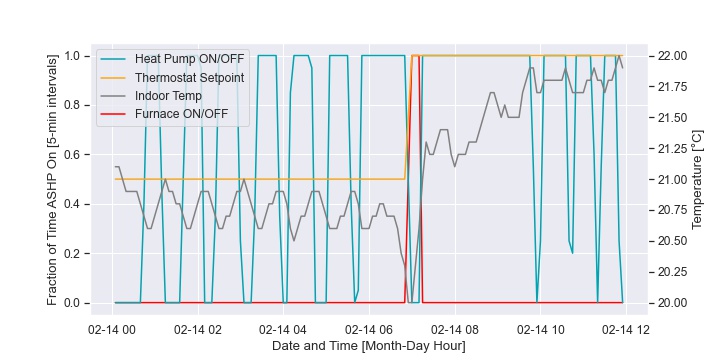
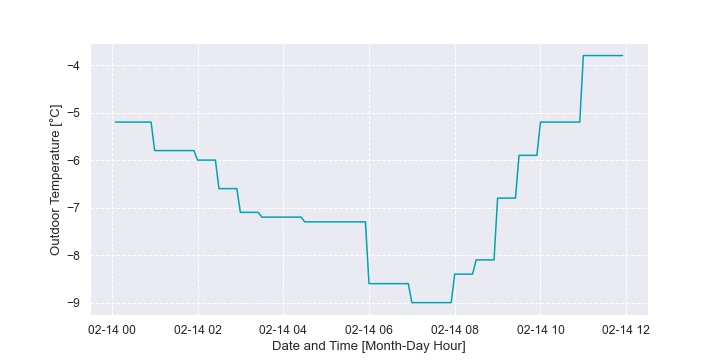
Figure 25. Ecobee operational data is shown over 12 hours in February 2024.
7.4 Future Net Savings Analysis
Different utility rates were applied to the gas consumption decrease and electricity increase provided in Table 9 to evaluate the impact of potential future rates on net savings or increases. As was the case with other homes, there is a net cost increase if gas is inexpensive and savings if gas costs escalate (for example, due to carbon pricing). Notably, this home utilized a heat pump that was lower cost, and lower efficiency, compared to other homes. There were more scenarios where there is a net increase in utility costs as a result.
Figure 26. The net savings (or increase) was evaluated for different potential utility rate scenarios that may occur over the system lifetime. Note that positive values represent savings, and negative values are an increase.
7.5 Homeowner Experience
The homeowner reported that the ASHP installed in this home was much quieter than the previous 27-year-old A/C unit. The homeowner also reported a quick installation, comfortable indoor temperatures, and that they have been recommending others to get heat pumps. When asked about their heating experience with the heat pump compared to the furnace they said:
“The heat pump works longer and the temperature the heat pump provides is more consistent or closer to the setpoint versus furnace which would be working for shorter periods of time and then blasting us with very hot air. I just prefer having longer working heat pump because it also circulates the air better.”
At the time, the homeowner chose the most affordable option. If they were to do it again now, with more options in the market and more experience, they said would get a cold-climate ASHP. After one year with the heat pump, the homeowner reported that the reduction in natural gas consumption completely offset the electricity use increase in terms of cost.
This contrasts against the analysis provided in Table 9, which showed a small increase, because this heat pump was installed in 2022 and the gas rate for Winter 2022/2023 for the first year of operation was higher. Overall, the homeowner reports being very satisfied with their heat pump, and it is working better than they had anticipated from their calculations.
8 Home 5 Results
8.1 Overview
Table 10 provides an overview of Home 5, and Figure 27 shows a picture of the installation. The homeowner did not provide an interview or survey and the research team was unable to confirm if the home had other changes or upgrades that would have impacted energy consumption. However, it is believed that the homeowners did other upgrades because the gas savings are larger than expected when compared to the electricity increase.
| Location | Brampton |
| Above Grade Conditioned Floor Area | 2,000 – 2,500 ft2 |
| Year Constructed | >1990 |
| Type | Detached; 2-storey |
| EnerGuide Audit Design Heat Loss | Not provided |
| ASHP Installation Date | 10/30/2023 |
| ASHP Make/Model | Mitsair; MOD30-24HFN1-MW |
| AHRI # | 211911381 |
| Nominal ASHP Size | 2 Ton |
| Region IV HPSPF/HSPF2 | 9.5/9.5 |
| Installed Cost (Pre-tax; Pre-rebate) | $6,550 |
| ASHP Rebate | $6,500 (CCASHP) |
| Furnace Make/Model | Not provided |
| Furnace AFUE | Not provided |
| Furnace Heating Output | Not provided |
Figure 27. Home 5 heat pump photo.
8.2 Utility Bill Analysis
Utility data analysis results are presented in Figure 28, and a seasonal summary is provided in Table 11.
Figure 28. Utility bill data analysis results for Home 5.
Table 11. Seasonal summary of utility analysis for Home 5
| General | |
| Period Analyzed Post-Installation | 11/30/2024 -4/26/2024 |
| Gas Consumption | |
| Modelled Total Baseline Gas Consumption | 1,746 m3 |
| Modelled Baseline Space Heating Gas Consumption | 1,272 m3 |
| Actual Gas Consumption | 660 m3 |
| Gas Reduction | 1,086 m3 |
| Relative Gas Reduction (Whole Home) | 62 % |
| Relative Gas Reduction (Space Heating) | 85 % |
| Electricity Consumption | |
| Modelled Baseline Electricity Consumption | 4,438 kWh |
| Actual Electricity Consumption | 7,112 kWh |
| Electricity Increase | 2,674 kWh |
| Carbon | |
| Carbon Reduction | 2.0 T CO2e |
| Utility Cost Change | |
| Net Utility Cost Savings at Current Rates (- for increases; + for savings) | +$145 |
| Performance | |
| Estimated COP (Based on Utility Changes) | * |
8.3 Furnace and Heat Pump Operation
The furnace operation throughout Winter 2023/2024 is shown in Figure 29, also illustrating the operation in different outdoor temperature conditions. The furnace takes over the space heating in outdoor temperatures less than -5oC, and sometimes in milder conditions.
Figure 29. Furnace operation is shown throughout Winter 2023/2024, considering different outdoor temperatures.
The Ecobee CCASHP operation data was aggregated on a 6-hour interval and plotted against outdoor temperature in Figure 30. The data was filtered to include only nighttime operation, time periods with the furnace off, and time periods where the setpoint didn’t change from the previous time period. The plot shows that this home is likely getting near maximum usage out of the CCASHP because it is operating 100% of the time before reverting to the furnace for heating.
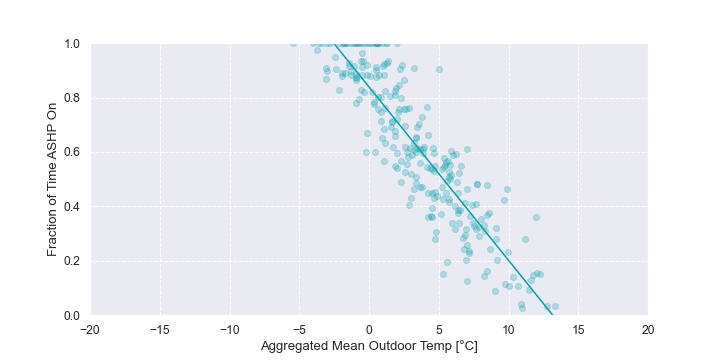
Figure 30. In this home, the heat pump is frequently operating at or near 100% before reverting to the furnace for heating. This suggests that it is being utilized near to its full potential.
Example operational data over two days is shown in Figure 31. In temperatures slightly colder than -4oC, the heat pump is regulating the indoor temperature close to the thermostat setpoint. The furnace turned on briefly in the time period covered by the plot. The indoor temperature had dropped to approximately 0.5oC below setpoint before this happened. It may be the case that the tolerances to turn the furnace are set relatively tightly in this home and that is part of the reason why the furnace is sometimes operating in milder conditions. Notably, during second day, the indoor temperature exceeded the setpoint with neither the furnace nor the heat pump turning on. The home may have high internal or solar gains.
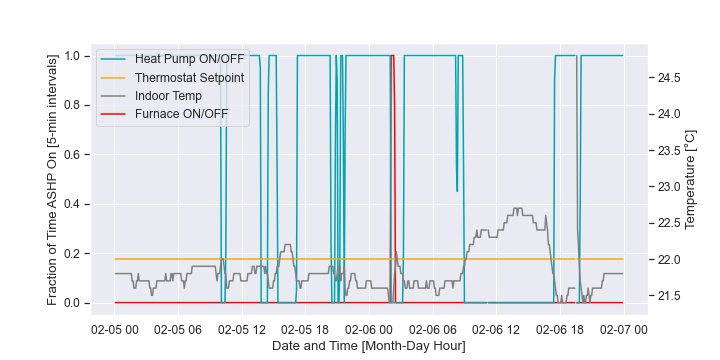
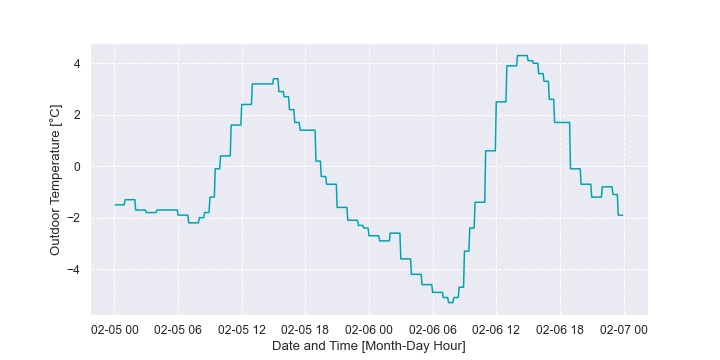
Figure 31. (Top) Operational data gathered from the Ecobee over 2 days of operation is shown for Home 5. (Bottom) Outdoor temperature data covering the same period.
8.4 Future Net Savings Analysis
Different utility rates were applied to the gas savings and electricity increase calculated for this home. A savings is likely in nearly all scenarios. The research team speculates that in addition to the CCASHP installation, the homeowners did additional energy upgrades, and this is partly the reason why the financial savings are as strong as they are. However, the homeowner did not respond to a request for an interview or survey from the research team so this could not be confirmed.
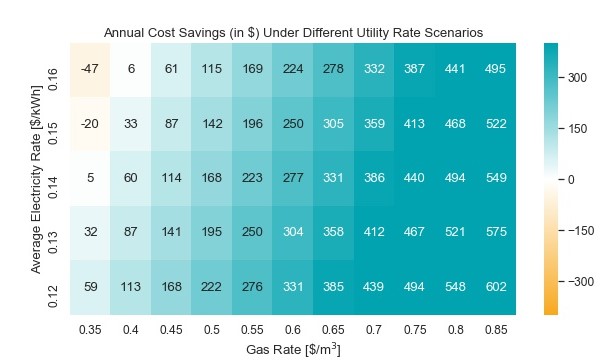
Figure 32. Savings is predicted in nearly every utility rate scenario considered.
8.5 Homeowner Experience
The homeowner did not respond to the research team’s request for an interview or survey.
9 Home 6 Results
9.1 Overview
Table 12 provides an overview of Home 6, and Figure 33 shows a picture of the installation. The homeowner noted that, in addition to the heat pump, they installed a heat pump water heater, added insulation to a crawlspace, replaced a door, and took measures to improve air sealing in the home between September and December of 2023. No corrections were made to the analysis to account for these other upgrades.
Table 12. Home 6 overview
| Location | Mississauga |
| Above Grade Conditioned Floor Area | 2,206 ft2 |
| Year Constructed | 1965 |
| Type | Detached; Side-split |
| EnerGuide Audit Design Heat Loss | 18.7 kW; 63.7 kBTU/hr |
| ASHP Installation Date | 1/25/2024 |
| ASHP Make/Model | Mitsair; MOD30U-30HFN1-MRO(X) |
| AHRI # | 211911377 |
| Nominal ASHP Size | 2.5 T |
| Region IV HPSPF/HSPF2 | 9.5/9.3 |
| Installed Cost (Pre-tax; Pre-rebate) | $8,000 |
| ASHP Rebate | $6,500 (CCASHP) |
| Furnace Make/Model | Keeprite; G9MVE0601714A1 (2-stage) |
| Furnace AFUE | 96% |
| Furnace Heating Output | 58 kBTU/hr (High-stage); 38 kBTU/hr (Low-stage) |
Figure 33. Home 6 heat pump photo.
9.2 Utility Bill Analysis
The utility analysis in this home had challenges. While the data used to build the baseline gas consumption model for the home spanned from 12/15/2021 to 1/13/2024, only 5 actual meter readings were taken by the gas utility in that period. To avoid confusion over estimated gas bills, and later corrections, this study only evaluated the gas consumption between successive actual gas meter readings. It follows that the baseline gas consumption was informed by relatively few data points, some of which represented long stretches of time.
Furthermore, the homeowner has an electric car, and this created a high degree of variability in the baseline electricity model. However, the electricity baseline model was not needed because the homeowner had a home energy monitoring system (Emporia) that directly measured the electricity consumption of the heat pump and the heat pump water heater.
A further challenge was that the homeowner used the new Ultra-low Overnight (ULO) rate structure and switched the Ecobee into furnace-only mode manually during peak time-of-use (TOU) when electricity was most expensive. Total electricity costs were determined using the process outlined in Section 3.5, using the actual measured electricity consumption of the heat pump and water heater in each time-of-use bracket. The weighted electricity rate for this home was 0.105 $/kWh.
The utility bill analysis proceeded in this home by using the same approach as in other homes to determine the gas savings. The gas savings included reductions from both the CCASHP and other measures including the heat pump water heater. The electricity increase was determined from the Emporia energy consumption data for the CCASHP and heat pump water heater.
Figure 34. (Left) The pre-retrofit gas utility data was used to form a baseline gas consumption model. (Right) The baseline gas consumption model was used to estimate the baseline gas consumption as a point of comparison for the actual gas consumption.
The electricity use breakdown for the CCASHP and heat pump water is shown in Figure 35. Less than 1% of the energy for these systems was consumed during the peak time-of-use bracket. A summary covering the full post-installation period is provided in Table 13. The utility changes suggest that this heat pump is operating with a lower overall efficiency than that used in other homes. The data collection was not sufficient to identify the root cause, however, it should be noted that it is not necessarily due to the equipment itself but could be related to installation-specific factors.
Figure 35. Time-of-use breakdown for the CCASHP and heat pump water heater.
Table 13. Summary of utility impacts
| General | |
| Period Analyzed Post-Installation | 1/31/2024 – 4/26/2024 |
| Gas Consumption | |
| Modelled Total Baseline Gas Consumption | 628 m3 |
| Modelled Baseline Space Heating Gas Consumption | 458 m3 |
| Actual Gas Consumption | 56 m3 |
| Gas Reduction* | 572 m3 |
| Relative Gas Reduction (Whole Home) | 91 % |
| Electricity Consumption | |
| Electricity Increase | 2,328 kWh (2,127 kWh for CCASHP; 201 kWh Heat Pump Water Heater) |
| Carbon | |
| Carbon Reduction (Annual EF) | 1.0 T CO2e |
| Utility Cost Change | |
| Net Utility Cost Savings at Current Rates (- for increases; + for savings) | +$30 |
| Performance | |
| Estimated COP (Based on Utility Changes) | 2.4 |
9.3 Furnace and Heat Pump Operation
In this home, the back-up furnace operation was dependent more on the peak electricity TOU bracket than outdoor temperature. Figure 36 plots the fraction of time the furnace is on as a time series heat map. The hour of the day is on the vertical axis and the day of the year is on the horizontal axis. Each hour of each day is then represented as a block of color. The band of colour that is sometimes seen from 4pm to 9pm (16:00 to 21:00) is the peak TOU bracket. It isn’t seen every day because the homeowner also drops the setpoint during this bracket which allows the house to “coast” through without active heating to a certain extent. This is illustrated in Figure 37.
Figure 36. A time-series heat map shows the furnace operation for different hours of the day on different days of the year. The furnace operation in a peak TOU is shown as the band of colour on the top of the plot. The furnace is rarely on outside of that peak TOU.
Figure 37 shows 24 hours of Ecobee data. The thermostat setpoint drops slightly during peak TOU and reverts to the furnace when heating is needed. Overnight, the temperature drops below -10oC, and the heat pump was on 100% of the time to meet the load. When the outdoor temperature dropped to approximately -12oC, the indoor setpoint began dropping, and the back-up was engaged to meet setpoint.
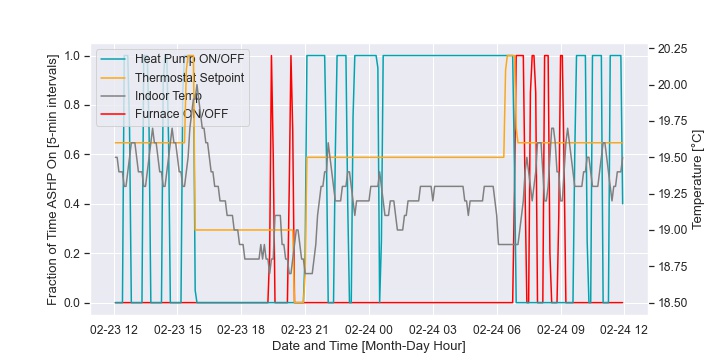
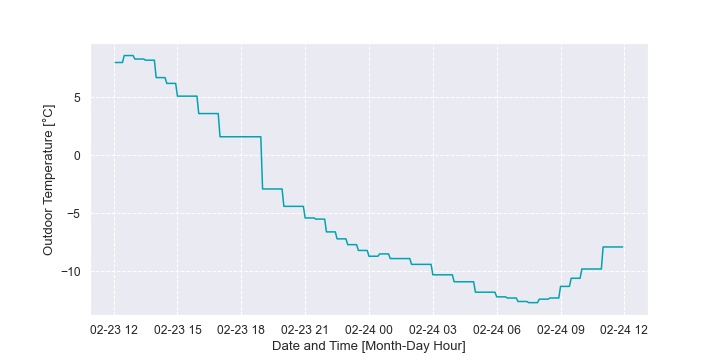
Figure 37. Ecobee thermostat is shown for 24 hours of operation in February 2024.
Figure 38 presents the fraction of time the heat pump was on as a function of the outdoor temperature. This data was aggregated on a 6-hour basis. It included only overnight operation and those hours where there was no furnace operation. For one data point, the CCASHP was operating 100% of the time in -10oC conditions and the overall trend predicts that it could continue to meet setpoint in slightly colder temperatures as well. Overall, the CCASHP is being used as much as it could, except for the furnace operation in a peak TOU.
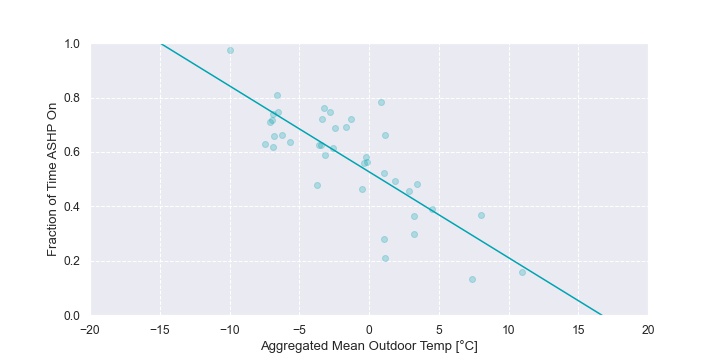
Figure 38. The CCASHP was operating at nearly 100% in -10°C conditions, suggesting it was utilized as much as possible with the exception of the furnace being used in a peak TOU.
9.4 Future Net Savings Analysis
The CCASHP consumption was nearly 50% in an ultra-low overnight TOU bracket and 20% in a weekend off-peak bracket. The furnace was used in peak TOU. This is why they were able to achieve a much lower weighted electricity rate than other homes, at 0.105 $/kWh. However, the utility changes also suggested a lower SCOP than that of other homes and the data collection was insufficient to determine root causes.
Assuming the homeowner continued operating the system in the same way regardless of future rate changes, Figure 38 shows the savings or increase (based on the 3 months considered) for different rates. If gas rates reduced drastically, the homeowner would have a small net increase in utility costs. However, savings could be substantial if carbon pricing continues to increase according to its current schedule. If the homeowner desired, they could still ensure savings in the face of lower gas rates by operating the heat pump only during the weekend and overnight off-peak TOUs. Combined, these brackets represented approximately a third of the current CCASHP’s consumption.
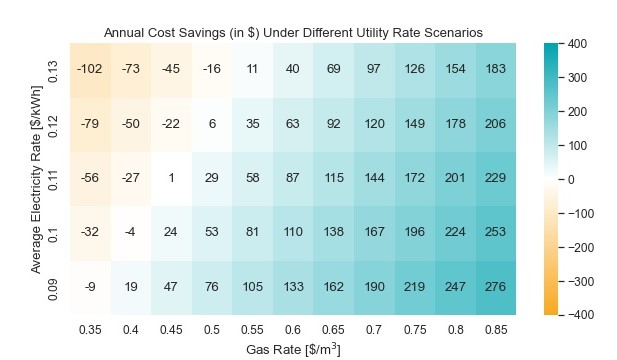
Figure 39. The net savings (or increase) was evaluated for different potential utility rate scenarios that may occur over the system lifetime. Note that positive values represent savings and negative values are an increase.
9.5 Homeowner Experience
The homeowner reported a great experience with their heat pump so far. The heat pump is very quiet compared to their old A/C unit, the home was comfortable, and they had a positive installation experience with their contractor. It was mentioned that it took some time to adjust to new thermostat scheduling and habits since the heat pump operates differently than the furnace.
The homeowner encountered some issues with the Ecobee thermostat control integration with the ultra-low overnight hydro plan during mid and on peak periods. The Ecobee does not have a feature that can natively switch between furnace and CCASHP based on TOU bracket.
To maximize cost savings, the homeowner manually switches the system from CCASHP to furnace during each weekday at 4pm and back to the heat pump at 9pm. This issue could be resolved with the purchase of a specialty thermostat; however, this would come at a premium cost. They noted they had tried third-party applications that integrate with the Ecobee but these were not successful for them. Overall, the homeowner was satisfied with their heat pump system, stating it is “Great so far. Comfortable, efficient, economical.”. They would recommend it to others and even helped their extended family have the same system installed.
10 Discussion
10.1 Results Summary
It is important to note that due to the timing of the CCASHP installations and subsequent recruitment into this study, the data analysis did not typically encompass the full 2023/2024 heating season. The fraction of the heating season included in the study for each home is shown in Table 14, assuming the full heating season encompassed the beginning of October to the end of April.
Table 14. Fraction of heating season covered by the utility data collection for each home.
| Home | Fraction of Heating Season Captured [%] |
| 1 | 70 |
| 2 | 28 |
| 3 | 75 |
| 4 | 100 |
| 5 | 68 |
| 6 | 40 |
The relative whole home gas consumption savings for each home is shown in Figure 40. It ranged from 62% to 91%. The estimated furnace gas savings is shown in Figure 41. It ranged from 77% to 100%. Home 6 was not included because the calculation process to estimate the fraction of furnace gas that was offset was not valid given that they upgraded their water heater as well.
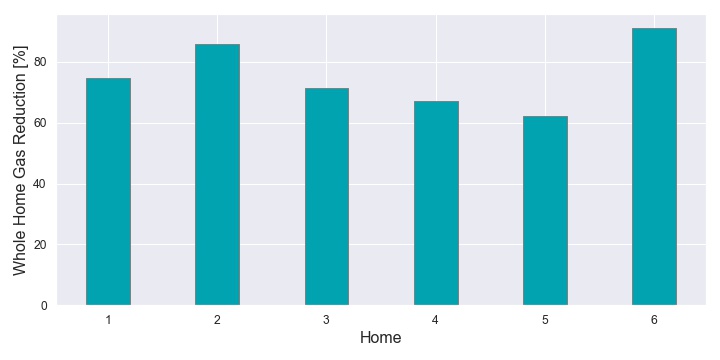
Figure 40. The whole-home gas consumption in the participating homes was reduced by between 62 and 91% for the time periods that were evaluated.
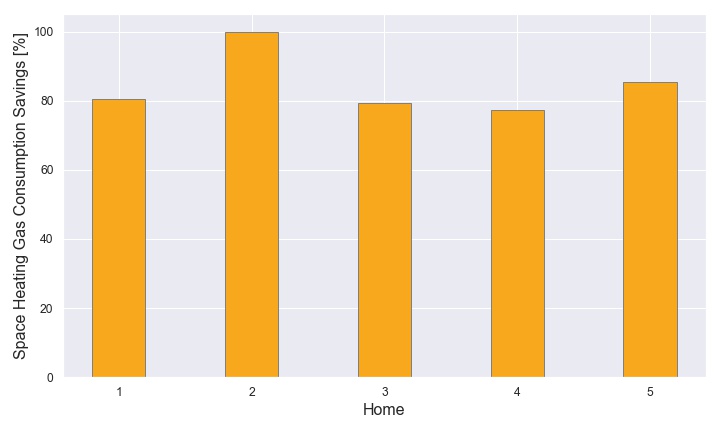
Figure 41. The estimated furnace gas reduction was typically near 80%, and in one case, much greater than 80%.
Net utility savings is provided in Figure 42. One home had a small increase in utility costs, others typically had a small decrease. Home 5 had a larger utility cost savings, but it is believed to be due to other factors beyond the CCASHP that could not be accounted for because the homeowner stopped responding to the research team.
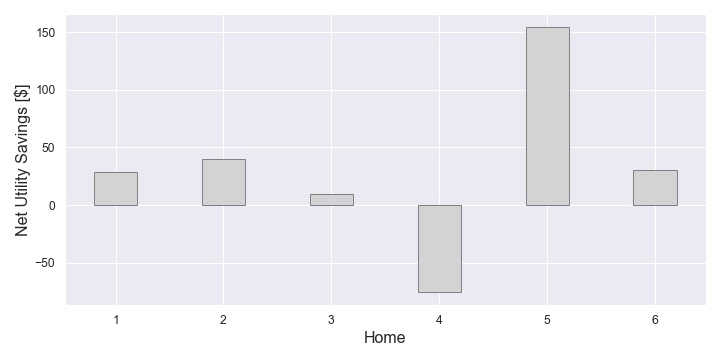
Figure 42. Net operating cost changes were typically close to break-even. Home 4 had increased operating costs because of a lower efficiency heat pump. Home 5 had greater savings because it is believed there were energy upgrades beyond just the heat pump, but this could not be confirmed.
Carbon reductions are shown in Figure 43. Different future utility scenarios were evaluated, and potentially large savings are possible if carbon pricing continues its current schedule. Conversely, net cost increases are possible if carbon pricing is removed. However, in that scenario, homeowners are not locked into using the CCASHP exclusively and can adjust its usage to achieve reasonable operating costs if desired.
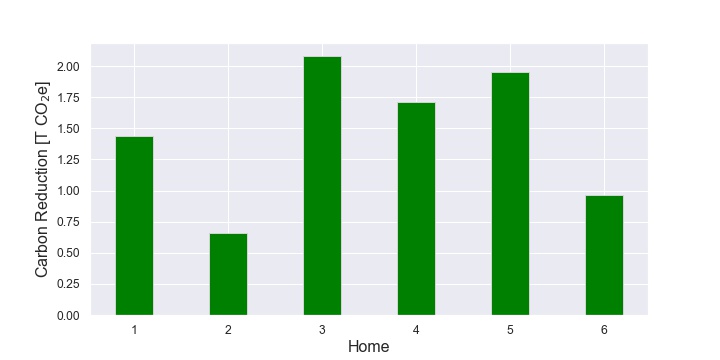
Figure 43. Carbon reductions were calculated for each home.
10.2 Interview Summary
The homeowners were generally happy with their heat pumps. They reported that the heat pumps kept their homes at comfortable temperatures throughout the heating season. Compared to their old A/C units, the heat pumps were much quieter despite longer run times.
One homeowner mentioned that the heat pump was a bit noisier than the furnace in the wintertime, but not by much. Overall gas consumption across the homes decreased, electricity use increased, and many homeowners stated they saved money overall on utilities. Other findings from the questionnaire (or interview) are listed below:
- 100% of homeowners would recommend heat pumps to others;
- 100% of homeowners stated their home was comfortable; and
- 100% of homeowners had a positive installation experience.
The homeowners in this study would recommend heat pumps to others looking to replace their A/C unit especially if a government rebate is available. The majority of homeowners were motivated to make the switch for energy savings and environmental benefits and would have made the switch earlier if they had known about heat pumps. Many homeowners have also or plan to make further changes to increase energy efficiency in their home.
Homeowners stated that it is important to note that heat pumps work differently than furnaces to heat the home. Instead of providing hot air into the home, it provides warm air. Because of this, it takes a longer for the heat pump to increase the indoor temperature.
10.3 Operational Lessons Learned
- Manual setpoint increases can unintentionally activate the furnace. For instance, in Home 2, large adjustments to the thermostat setpoint triggered the furnace to come on. One approach that homeowners can use to prevent this is by adjusting the “Aux Heat Max Outdoor” setting to a lower threshold, ensuring the auxiliary does not engage when outdoor temperatures are above this limit. Alternatively, programming a consistent setpoint schedule can help maintain comfort while helping to avoid furnace operation.
- Tight settings on the “Aux Savings Optimization” parameter can lead to unnecessary furnace use. This was believed to be an issue as observed in Home 5, where the furnace was turning on if the indoor temperature undershot the setpoint by a relatively small amount. Adjusting this parameter to a higher value can reduce furnace operation but would result in greater variation in indoor temperatures. Adjusting the “Aux Heat Max Outdoor” similarly to the previous bullet can also help prevent unwanted furnace operation.
- Thermostat setback can effectively save energy without activating the furnace unnecessarily. In Home 1, using a thermostat setback schedule did not end up engaging the furnace unnecessarily. Proper setup in the Ecobee thermostat ensures the heat pump anticipates and meets temperature changes without fallback to the furnace. Adjusting the “Aux Heat Max Outdoor” setting can also prevent unnecessary furnace activation.
- Setting the “Compressor Min Outdoor Temperature” too high can limit heat pump utilization. This was noted in Home 3. The system automatically reverted to the furnace in temperatures below -4°C, but it was clear the CCASHP would have been capable of meeting the setpoint for much of the time in colder temperatures where the furnace was used.
- Improved time-of-use control for the Ecobee is needed. This is clear in Home 6, with the homeowner manually changing the configuration during a peak TOU when using the new ULO rate structure. Current solutions that integrate with Ecobee can manage basic time-of-use control, but they require technical expertise and are susceptible to issues. Investing in advanced thermostats that support time-of-use control can offer more reliable management, but potentially at a higher upfront cost.
- Proper thermostat placement is crucial for consistent indoor temperatures. In Home 3, the thermostat location significantly influenced temperature swings between the furnace and heat pump. Placing the thermostat in a central living area, away from direct sunlight or drafts, and ensuring adequate supply and return airflow improves overall temperature regulation in a home. Thermostats may also have external sensors that can provide a better control point when the physical thermostat placement is not ideal.
10.4 The Case for Replacing A/C Units with CCASHPs in the Current Landscape
Most of the heat pumps evaluated in the study received a rebate from the Enbridge HER+ program. The rebate covered most of the upfront costs. However, the HER+ Program, along with the CGHG Program, were phased out ahead of schedule in early 2024. This changed the financial landscape for many homeowners looking to install a CCASHP.9
For Ontario homeowners that are currently heating their home with natural gas, key points are listed below that should be considered when choosing between an A/C unit and a CCASHP:
1. Enbridge Home Energy Rebate and Greener Homes Loan Availability: At the time of writing, The Canada Greener Homes Loan is still available for qualifying homeowners and it reduces ownership costs by offering no-interest financing for 10 years. In addition, Enbridge has recently announced (July 2024) their Home Energy Rebate (HER) Program which offers $600 for an Energy Audit and up to $2,000 for a qualifying CCASHP installed before December 31st, 2025.10 To understand the financial impacts of this, consider the following example:
- Assume a 2-Ton CCASHP is installed for $6,500 + HST (similar to Home 5). Also assume that the system receives a HER Program rebate of $1,000 according to the program guidelines for a 2-Ton CCASHP. An EnerGuide Audit is approximately fully funded by the HER Program. Assume the system is financed at no-interest for 10 years through the Canada Greener Homes Loan Program. The monthly cost of the equipment would be $52.88 for 10 years.
- Alternatively, assume a basic conventional air-conditioner costs $4,000 + HST, and that it is financed and paid off over 10 years. Assume 7% interest. Under these assumptions, the monthly payment would be $52.48. The CCASHP equipment costs are therefore competitive with a conventional A/C unit under these assumptions. This is an example calculation, and a homeowner can assume their own quoted costs for A/C and CCASHP.
- The result is similar even if paying out of pocket for the A/C, because getting a CCASHP with no-interest financing keeps more money in the homeowner’s pocket today and this is a financial benefit. It allows them to invest (and earn a return) or pay off other debt (and avoid interest charges on that debt).
2. Mitigating Future Gas Rate Increases: The CCASHP mitigates the financial risk of future gas rate increases. At current utility rates, hybrid systems are typically close to break-even on utility costs with standard furnace-only heating. Although future utility rates are uncertain, in some potential scenarios within the system’s lifetime, an ASHP might reduce utility bills by several hundred dollars per year for some homes. This was seen in Home 5.
3. Improved Features of Inverter-Driven CCASHPs: A CCASHP offers improved features compared to a basic A/C unit. Homeowners noted quieter operation in interviews. CCASHPs are likely to have improved cooling efficiency versus basic A/C units, potentially reducing summertime electricity bills. They may also offer better dehumidification and temperature regulation in the summer, as the inverter of the CCASHP allows modulation of cooling output and longer operating cycles at partial loads.
11 Conclusion
This study demonstrated substantial benefits for installing air-source heat pumps in conjunction with existing furnaces for heating in Peel Region, Ontario, during Winter 2023/2024. Homeowners experienced significant reductions in whole home gas consumption, ranging from 62% to 91%, and typically saw their furnace gas usage decrease on the scale of 80%. Most homes achieved near break-even utility bills at current rates compared to their previous consumption.
Homeowners reported high satisfaction levels, noting comfortable indoor temperatures, quieter operation than previous air conditioning units, and overall utility savings. They unanimously recommended CCASHPs to others and expressed that they would have switched earlier had they known about the technology and its benefits. Operational lessons highlighted the importance of strategies to mitigate unwanted furnace operation and optimize CCASHP use in cold temperatures.
The HER+ Program significantly reduced upfront costs for the CCASHP installations. Despite it’s phase-out in early 2024, the financial case for CCASHP vs. A/C units is still compelling given the recently announced HER Program and the Canada Greener Homes Loan. CCASHPs not only mitigate the risk of future gas rate increases but also offer potential long-term utility savings and enhanced features compared to basic air conditioning units, such as quieter operation, improved cooling efficiency, and better temperature control. The positive experiences and benefits documented in this study makes a strong case case for replacing traditional air conditioning units with CCASHPs.
12 Project Team
- Erik Janssen, Research Scientist, Sustainable Technologies Evaluation Program, TRCA
- Doris Choi, Analyst, Sustainable Technologies Evaluation Program, TRCA
- Ricardo Brown, Monitoring Technician, Sustainable Technologies Evaluation Program, TRCA
- Gil Amdurski, Program Manager, Sustainable Technologies Evaluation Program, TRCA
- Meredith Gibson, Coordinator, Sustainable Communities, TRCA
- Justyna Braithwaite, Program Manager, Sustainable Communities, TRCA
13 References and Endnotes
[1] The Atmospheric Fund. Carbon Emissions Inventory Report, 2022. https://carbon.taf.ca/
[2] Smart-switching hybrid heating systems have been evaluated in previous STEP research. See “London Residential Smart Hybrid Heating Pilot: System Performance Analysis” at: https://sustainabletechnologies.ca/home/heating-and-cooling/air-source-heat-pumps/smarter-home-heating/london/
[3] October 2022 detailed gas rate breakdown: https://www.oeb.ca/sites/default/files/qram-egi-20221001-en.pdf.
[4] The impact of the Federal Carbon Charge on natural gas costs is provided by Enbridge here: https://www.enbridgegas.com/residential/my-account/rates/federal-carbon-charge
[5] October 2023 detailed rates provided here: https://www.oeb.ca/sites/default/files/qram-egi-20231001-en.pdf. January 2024 detailed rates are provided here: https://www.oeb.ca/sites/default/files/qram-egi-20240101-en.pdf.
[6] Ontario Energy Board Bill Calculator: https://www.oeb.ca/consumer-information-and-protection/bill-calculator
[7] National Inventory Report 1990-2021: Greenhouse Gas Sources and Sinks in Canada, Part 2, Table A6.1-1 and Table A6.1-3. Emission factors from CO2, CH4, and N2O were combined.
[8] The Atmospheric Fund. Ontario Electricity Emissions Factors and Guidelines, June 2024. https://taf.ca/custom/uploads/2024/06/TAF-Ontario-Emissions-Factors-2024.pdf
[9] Note that other programs still exist in Ontario that apply to some homeowners. For example, Energy Affordability Program from Save on Energy supports ASHP retrofits in electrically-heated homes for income-eligible participants. The Federal Oil to Heat Pump Affordability Program also provides a rebate to qualifying participating transitioning from oil heating. The Clean Home Heating Initiative (CHHI) from Enbridge has been piloted in different regions of Ontario.
[10] See program requirements and timelines here: Home Efficiency Rebate | Enbridge Gas